Tutorial
What is Thunor Web?
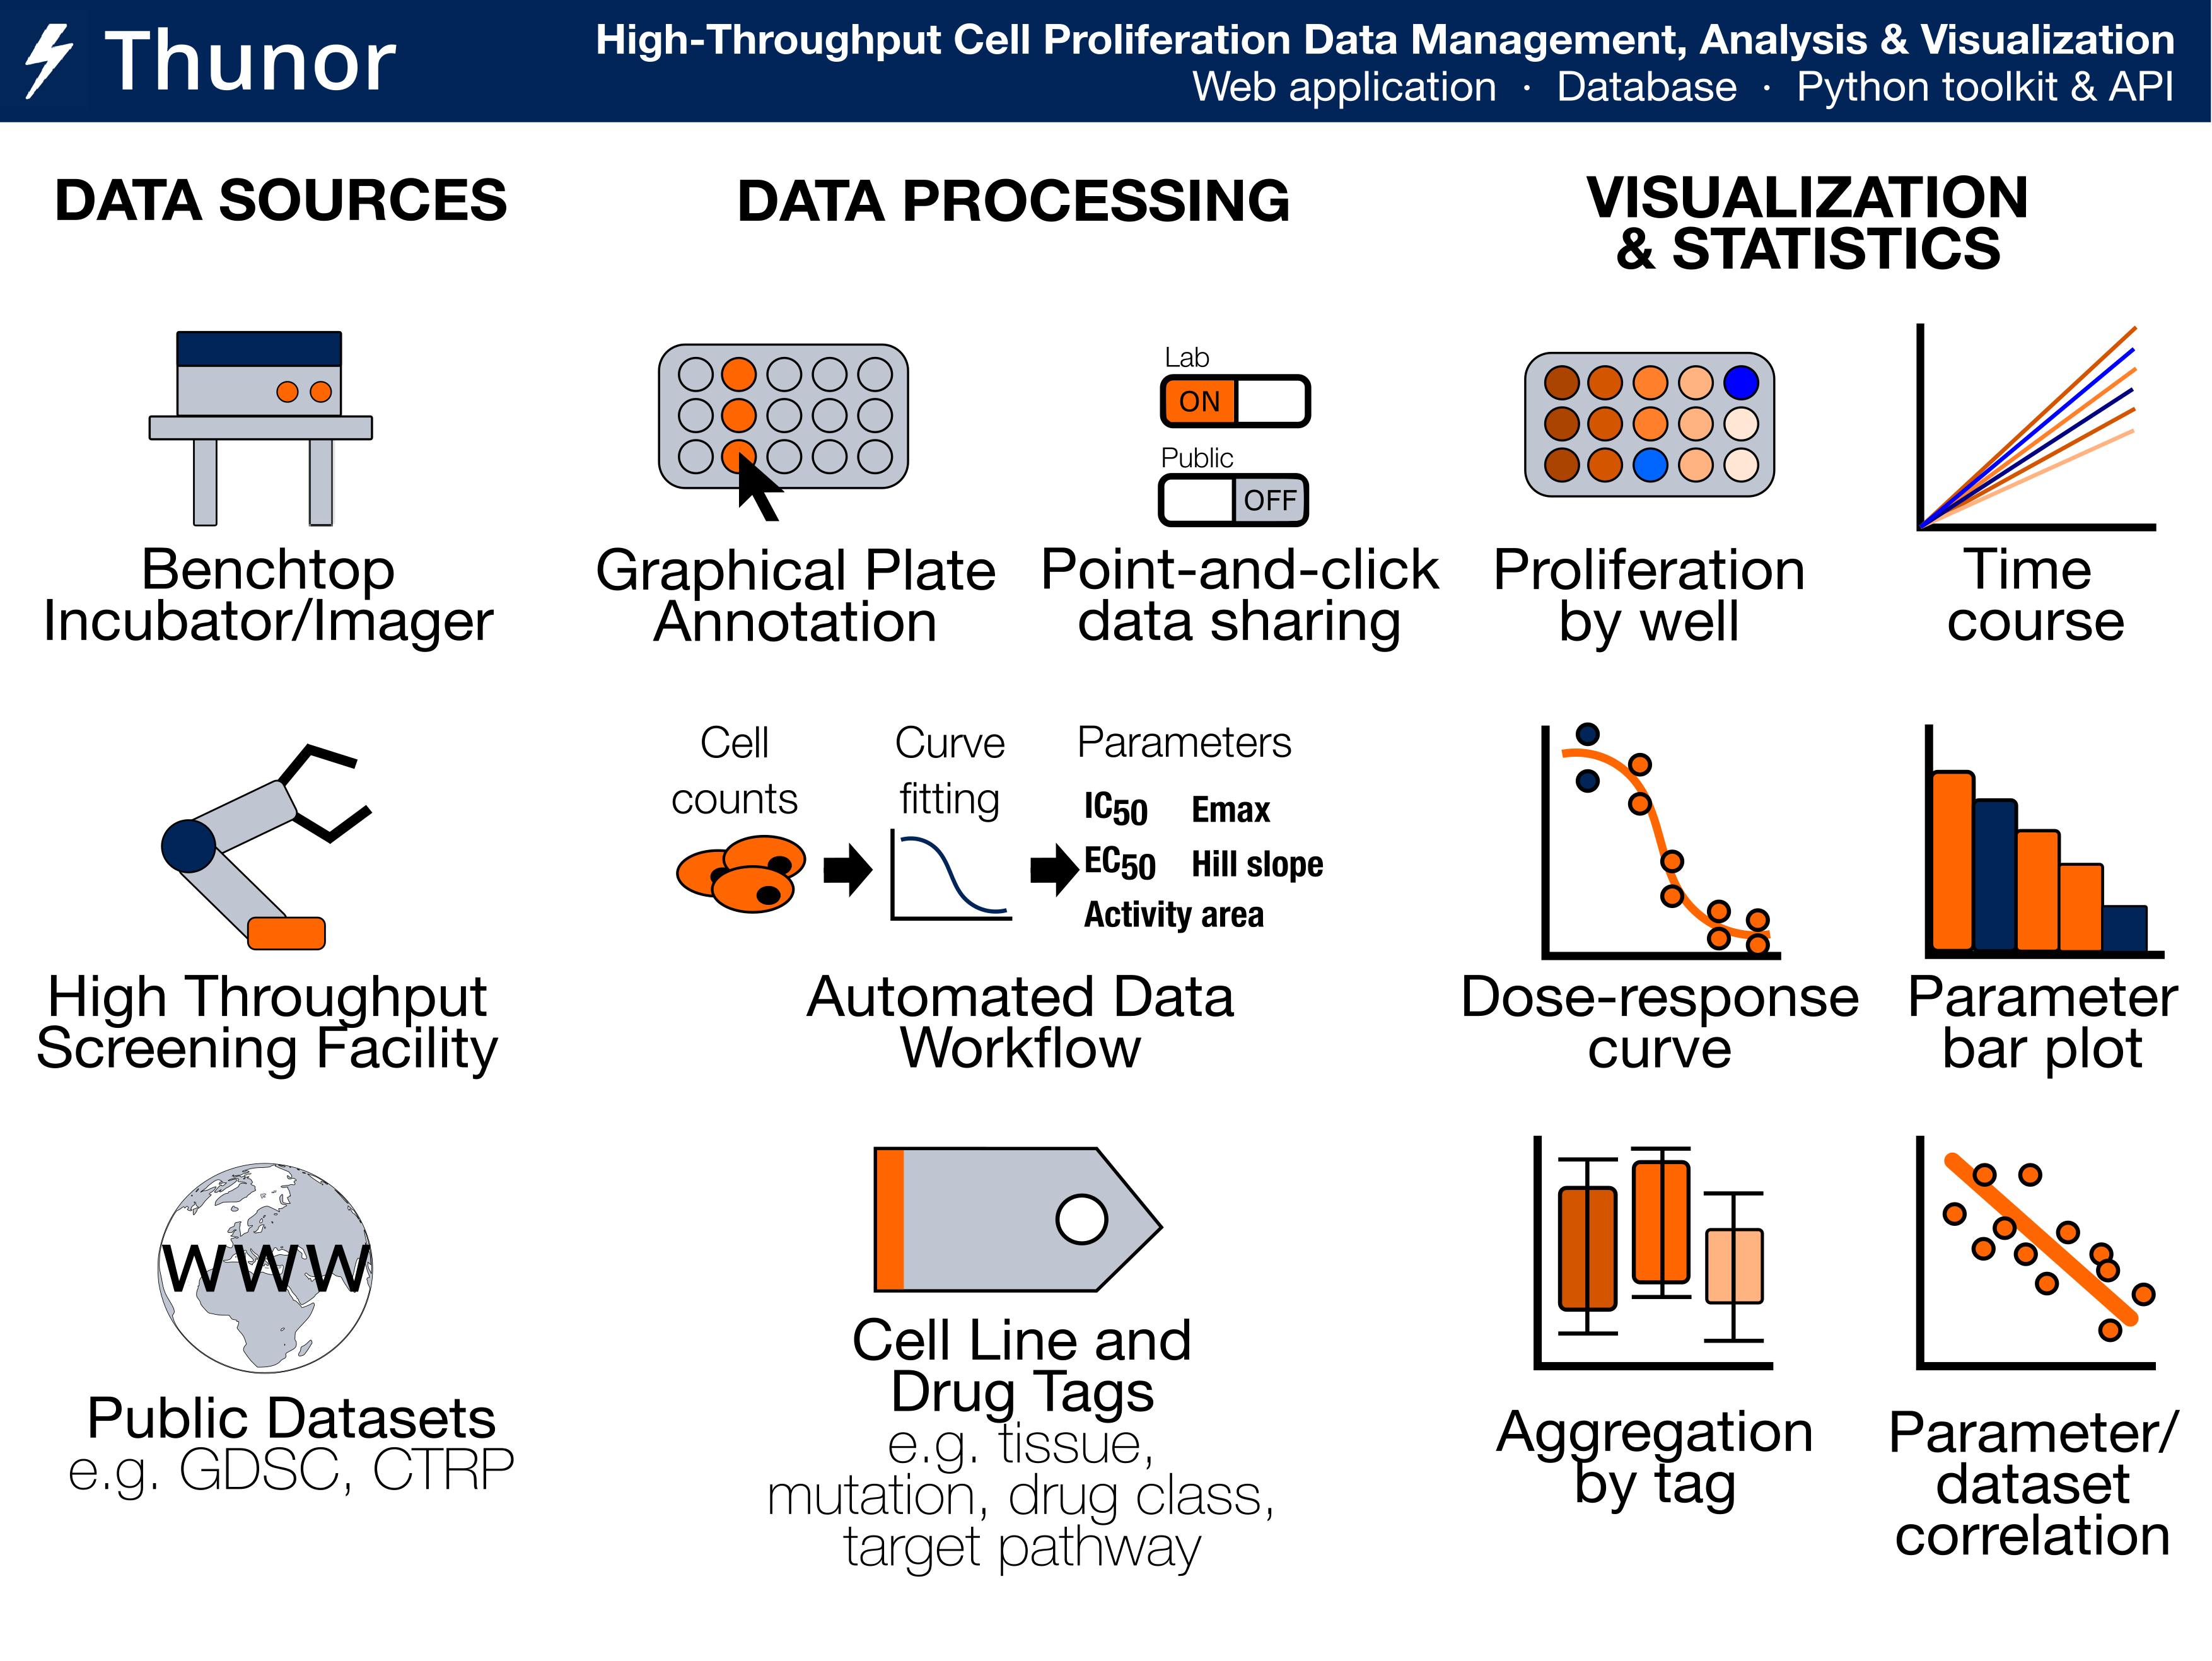 Image: Thunor Web - Overview of Features
Thunor Web is a web application for managing, visualizing and analyzing high throughput screen (HTS) data. It works with both end-point and time-series dose-response cell proliferation data, where it calculates viability scores and the DIP rate respectively. Key features include data management and sharing, automated DIP rate calculation, a plate mapper to label multi-well plates with cell lines, drugs, and drug concentrations, dose-response curve fitting, derived parameter calculation and comparison (e.g. IC50, Emax, activity area; see parameters), and, a tag system for annotating drugs and cell lines for aggregation and categorical analysis/visualization.
Many of these features are also available for programmers in a Python library with Jupyter Notebook compatibility called Thunor Core, which can be used separately or together with Thunor Web. See Thunor Core documentation for more information.
Thunor Web is a modular application written in Python and deployed using Docker Compose. For further details on the software and technology stack, see design and components.
Can I try Thunor Web without installing it?
Absolutely. See our online demo, which has been pre-loaded with example data. You can view example plots, example cell line tags, and an example plate map.
System Requirements
Thunor utilizes Docker containers built for computers with Intel or AMD CPUs (x86-64) and ARM CPUs (arm64) - the majority of laptops, desktops, and servers. Windows, MacOS, and Linux are all supported.
- Docker and Docker Compose v2 (i.e.
docker composeshould work, without a dash). Follow instructions for your platform:- Docker for Windows
- Docker for Mac
- Docker for Linux
- Other platforms: Docker installation instructions
- A Python installation*. Python 3.6 or later is recommended, but other versions will probably work - it is only used for the configuration script.
- Git*
*If you use MacOS or Linux, you probably already have Python and git installed. If you use Windows, we recommend installing Anaconda, a Python distribution which includes lots of useful software.
Installation steps
These steps cover a local-only (single machine) installation. For a network-accessible installation, see the full installation instructions.
-
Retrieve the Thunor Web quick start tool
git clone https://github.com/alubbock/thunor-web-quickstart thunor-web cd thunor-web -
Run the Thunor Web deploy script
python thunorctl.py deploy --hostname=localhost -
Create an admin account
python thunorctl.py createsuperuser
That's it! Thunor Web is now ready to start. If you encounter any issues, please see the installation FAQs for further guidance.
Load the site in a browser
Open a web browser to http://localhost and you should see the Thunor Web login page.
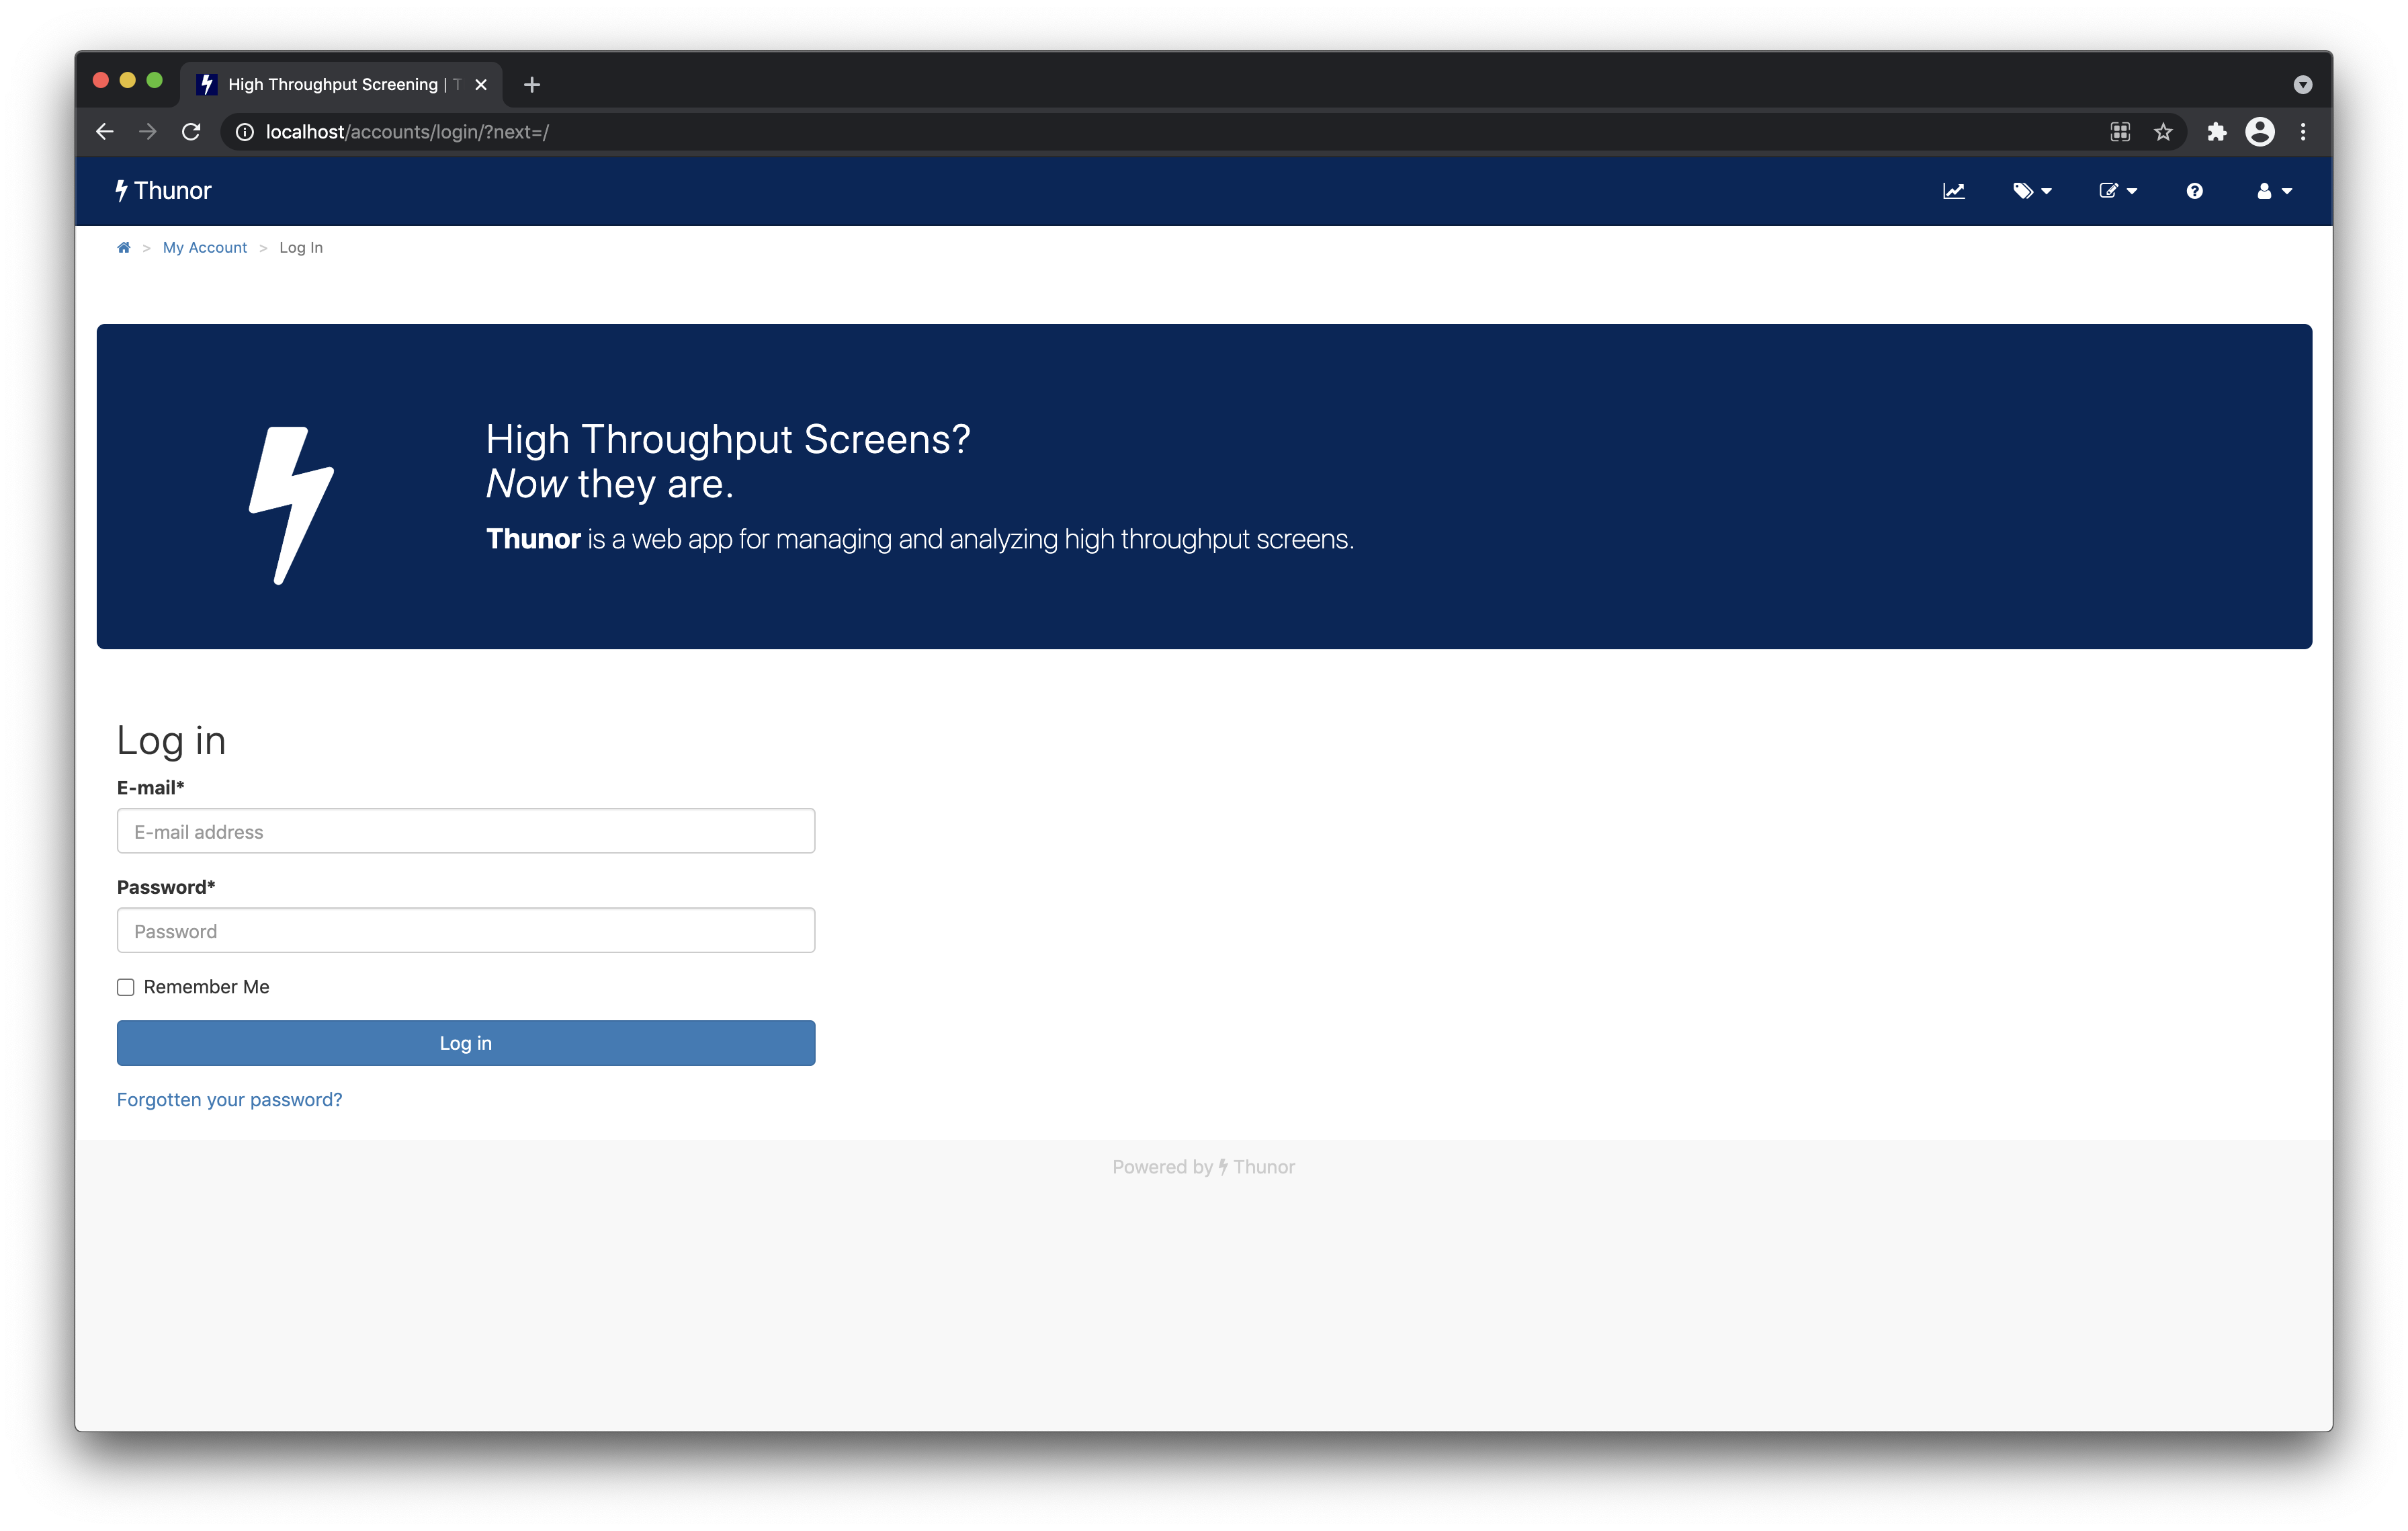 Image: Thunor Web login page
If you cannot load the page, check that Thunor Web has started - run:
python thunorctl.py start
Check the installation FAQs if you encounter any issues.
Log in and home page
Enter the email address and password that you created during the installation process into the form in your browser, and click the Log In button. You should now see the home page.
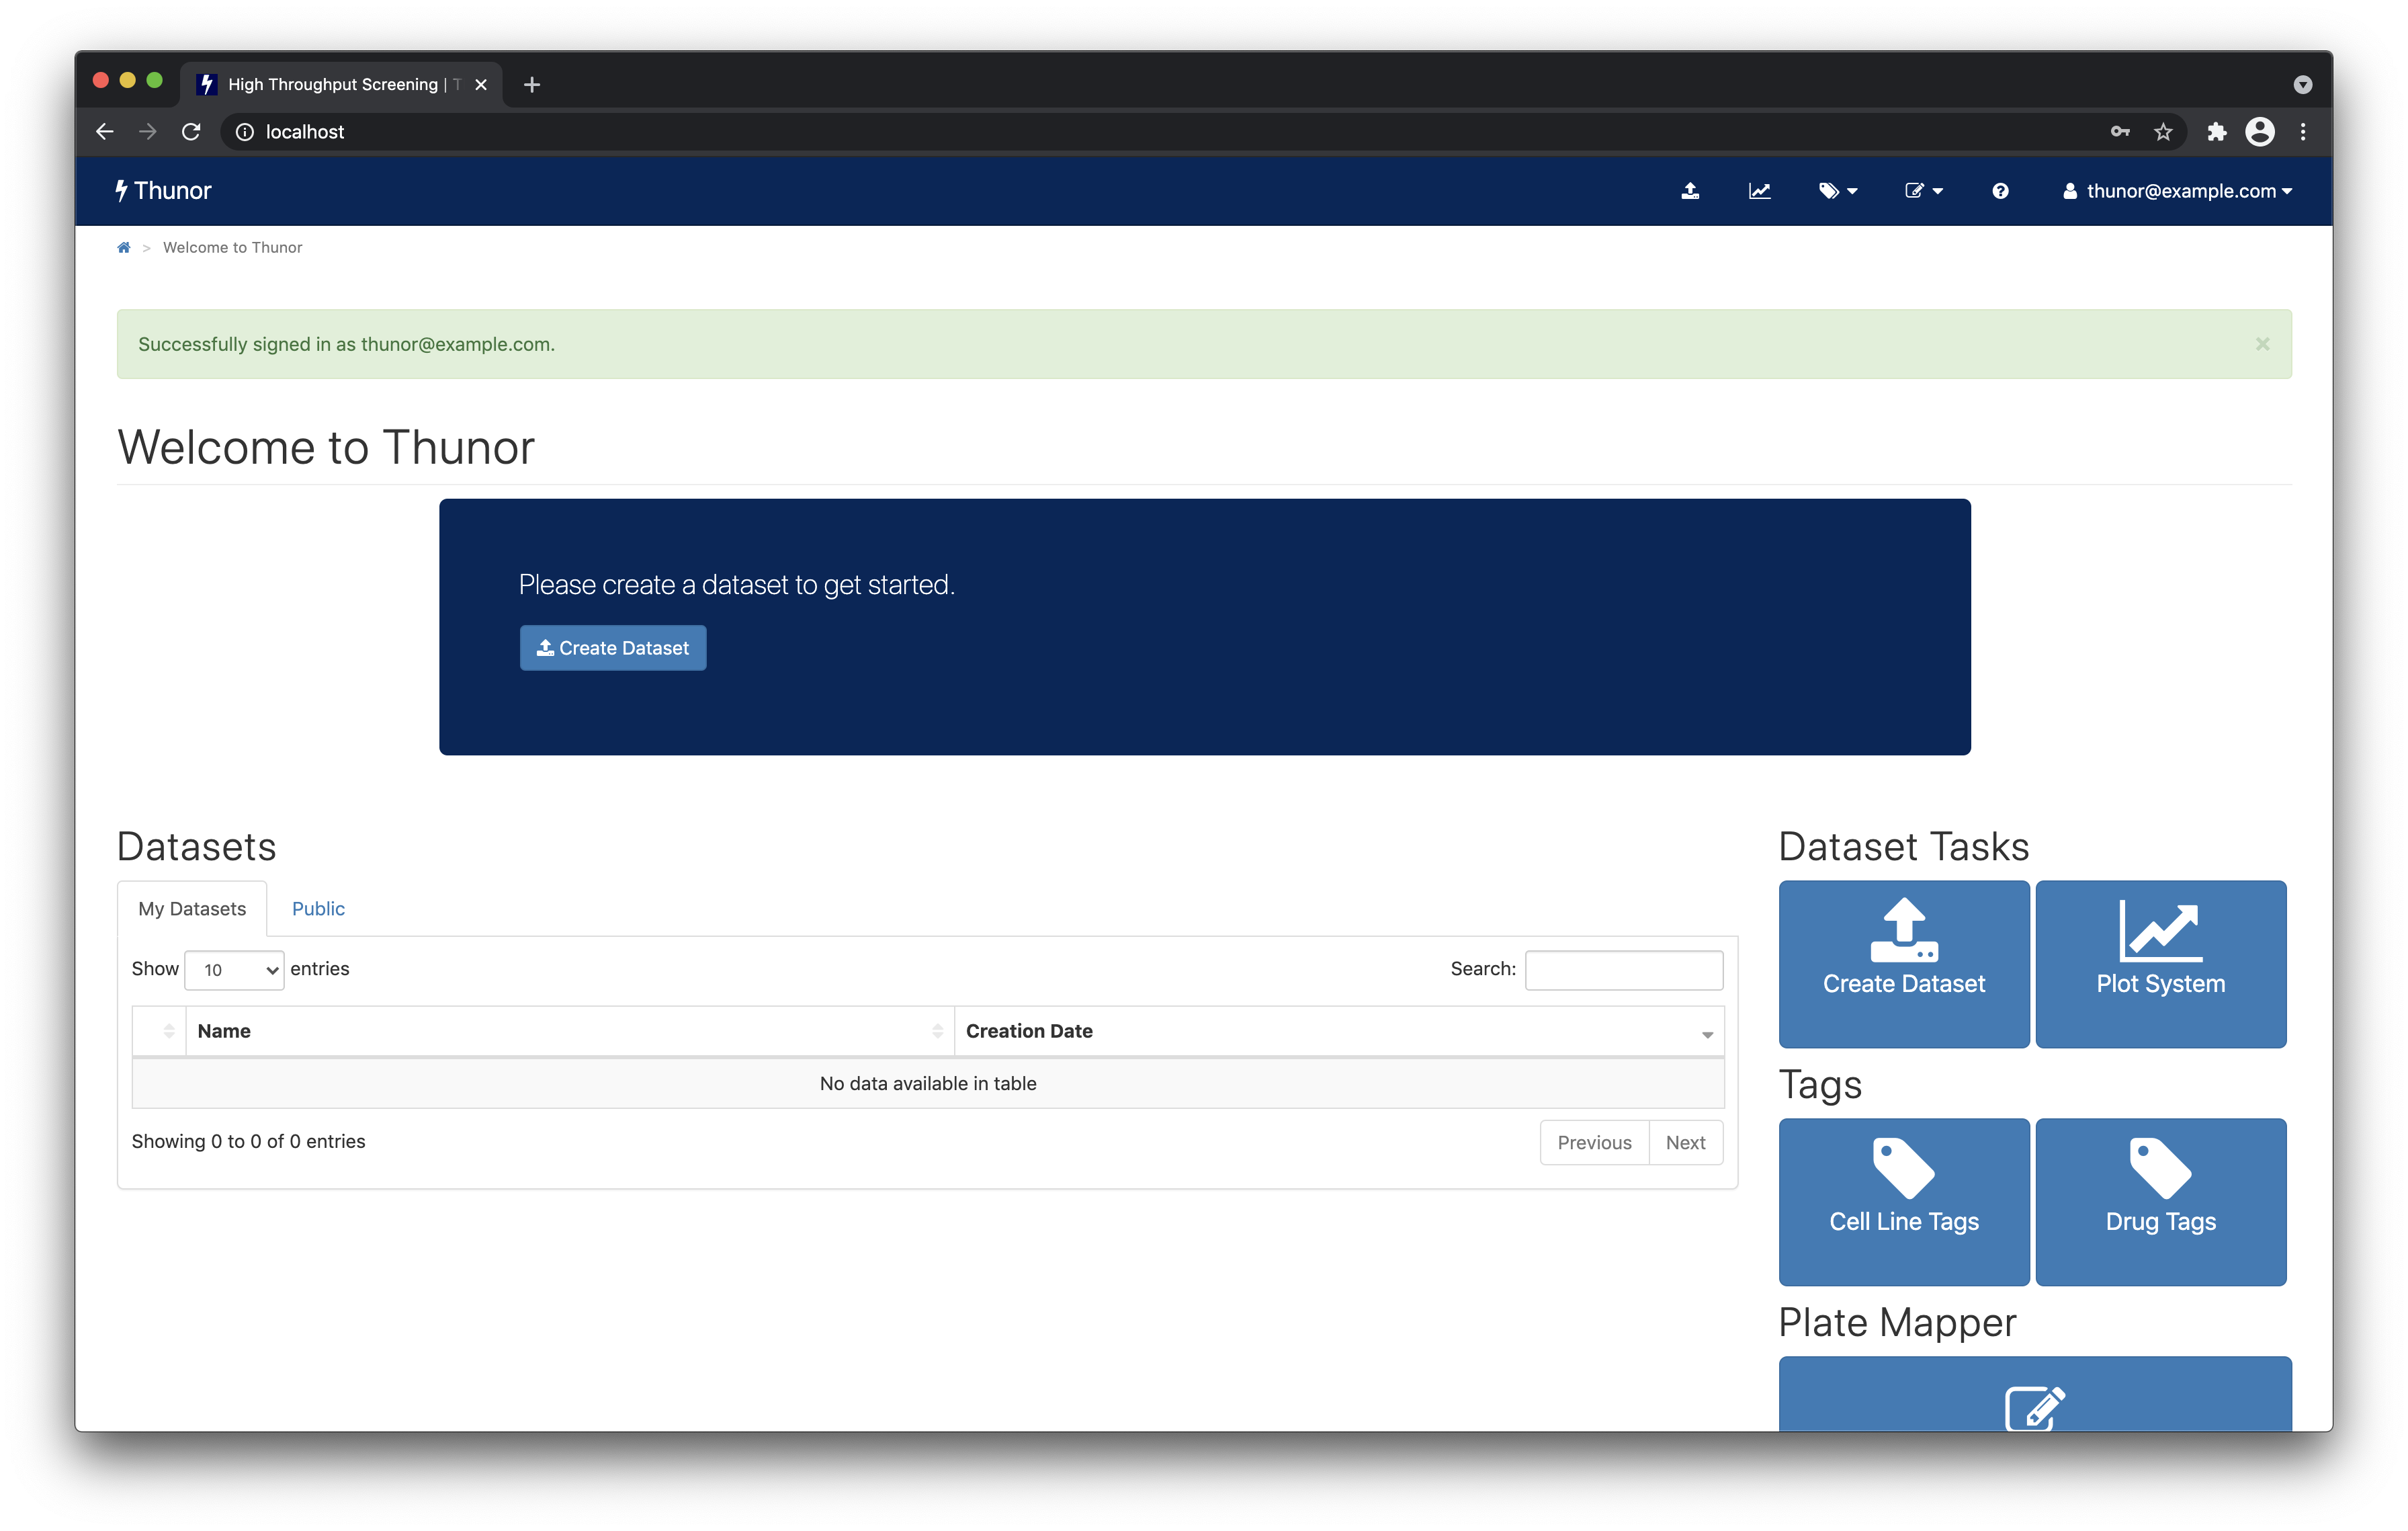 Image: Thunor Web home page
Upload a dataset
First, you'll need some data. Download the example HTS007 dataset, which is a comma-separated value (CSV) file containing 8 cell lines and 27 drugs quantified as cell proliferation time course data (i.e., the number of cells at each time point in each condition). See our documentation on the dataset page for information on the file format (or open the CSV file in a spreadsheet program like Microsoft Excel).
Next, from the home page, click the Create dataset button. Give the dataset a name (HTS007 seems appropriate), like the screenshot below, and click Next.
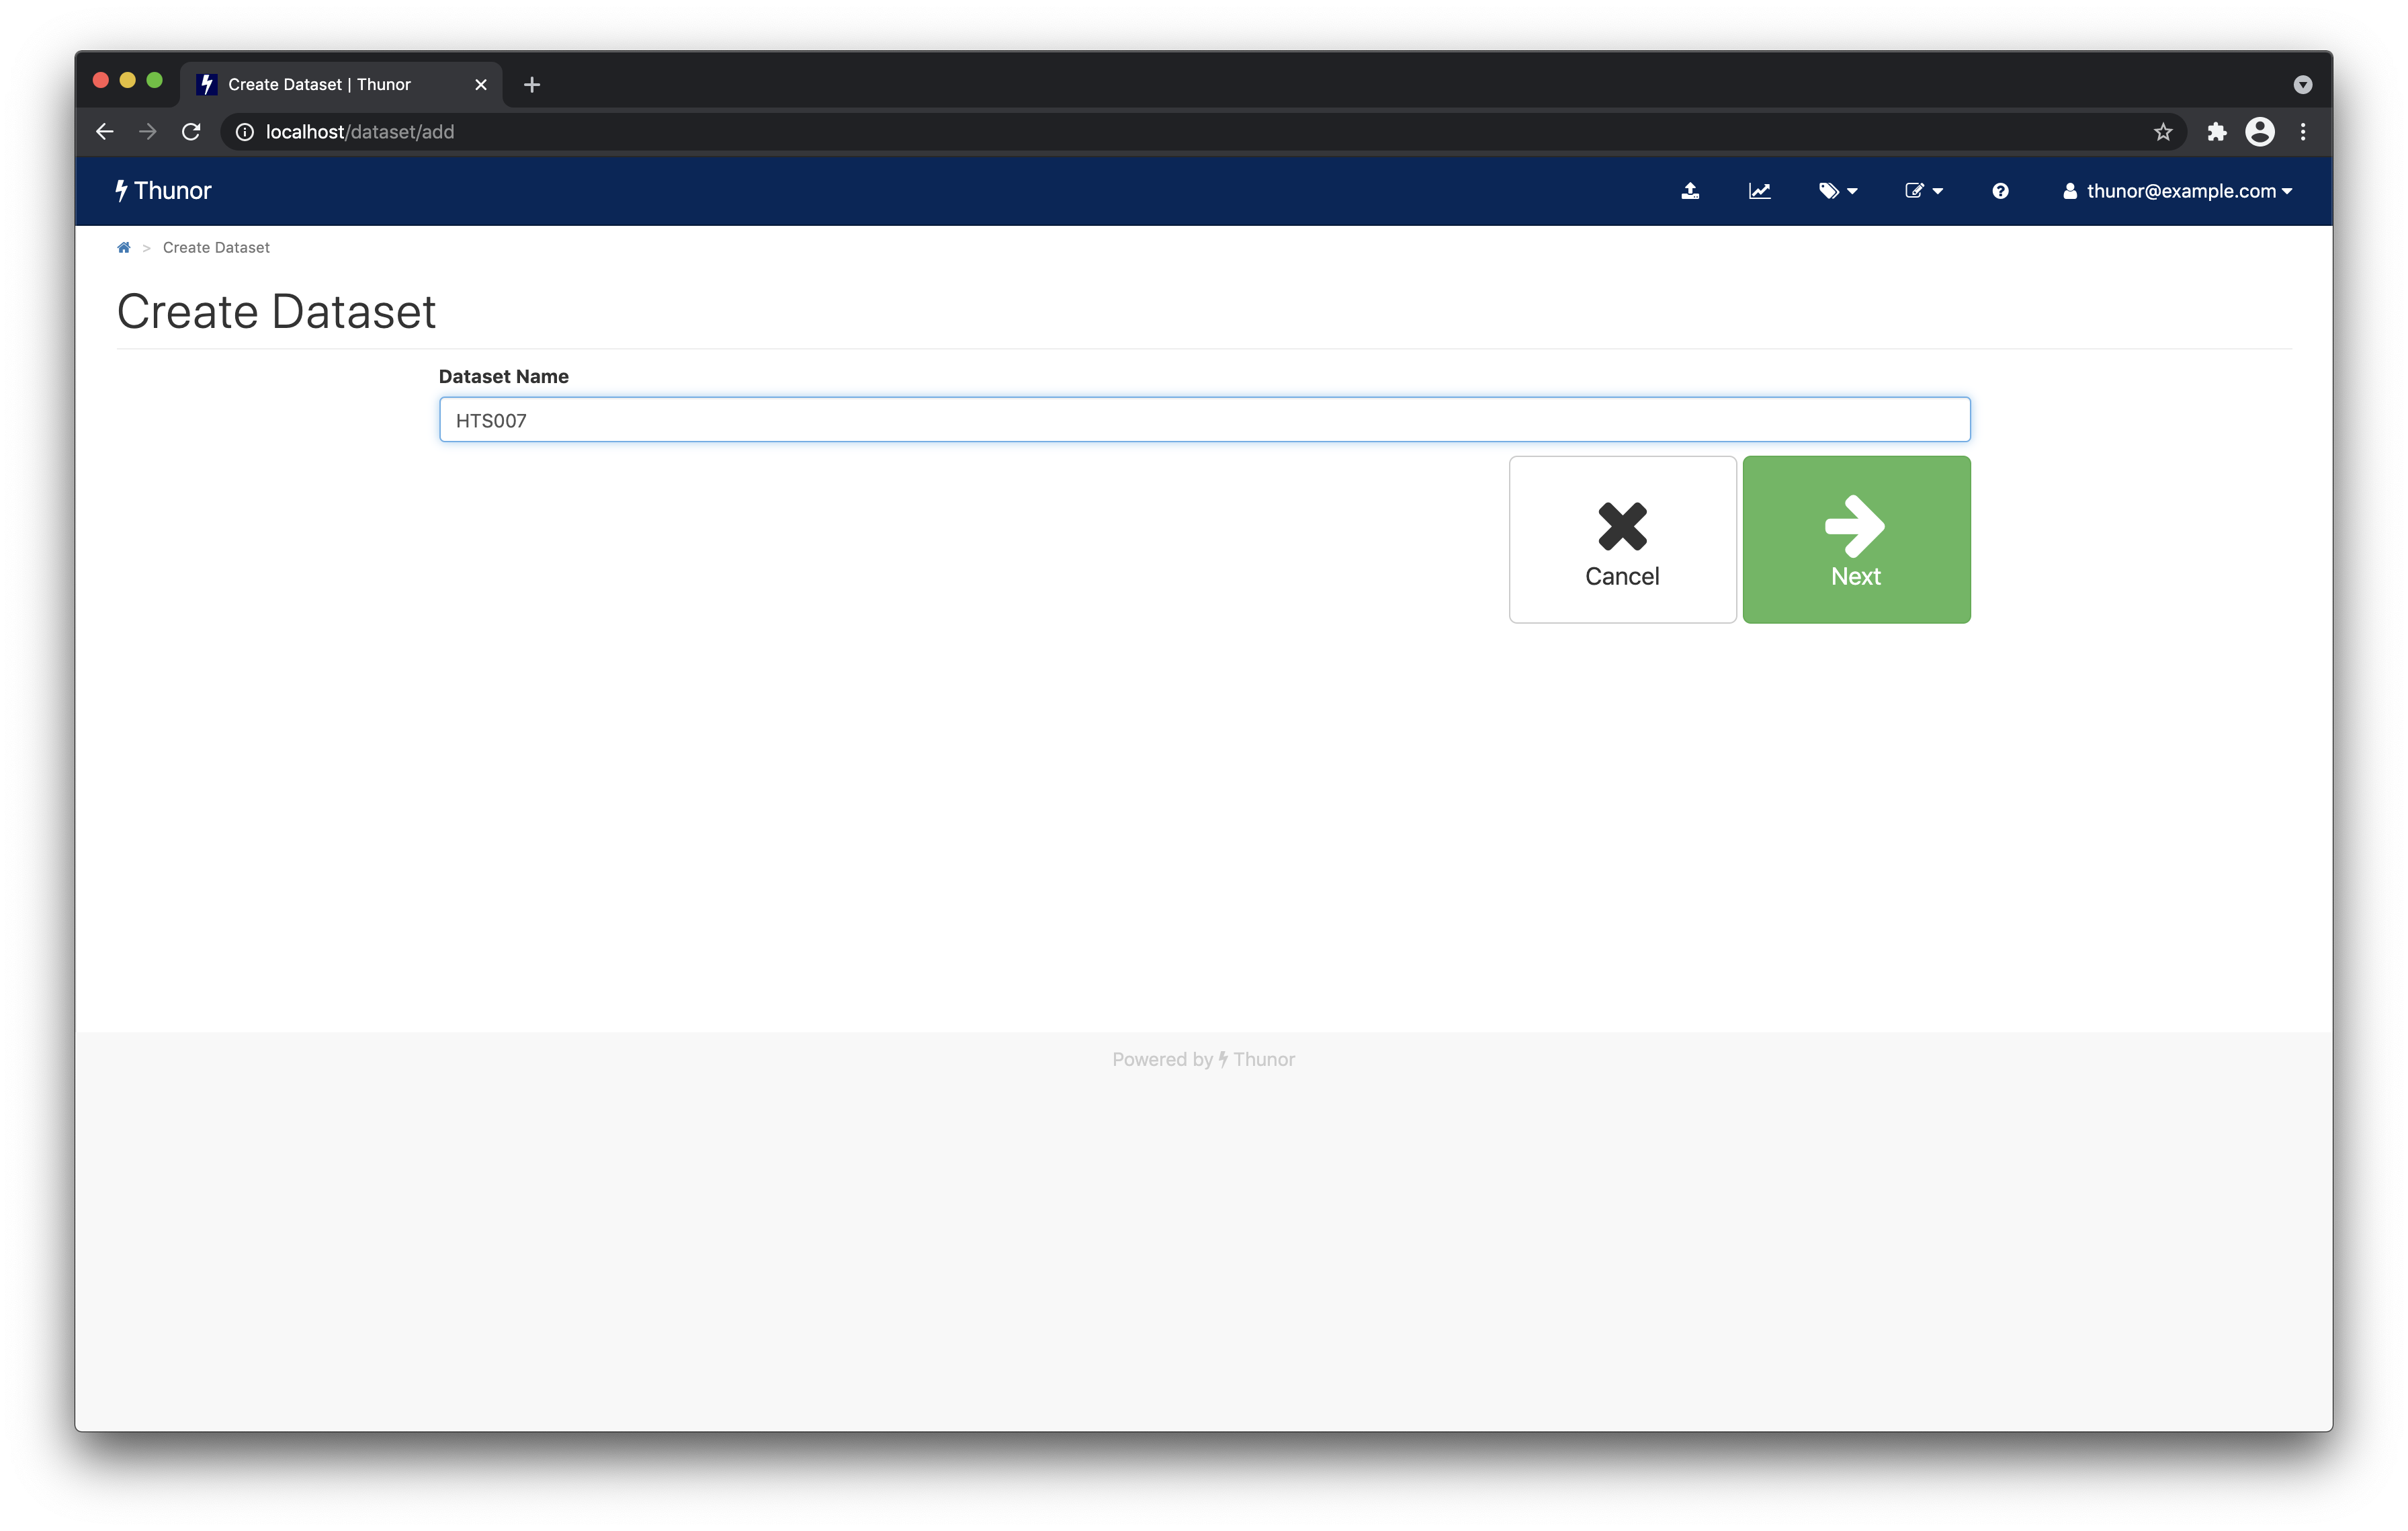 Image: Thunor Web - create a dataset
On the next screen, you'll see an area where you can upload files. You can either:
- Drag-and-drop the hts007.csv file you downloaded earlier (from Windows Explorer, Finder on a Mac, etc.) into the dotted area; or
- Click within the dotted area and browse for the hts007.csv file
The file should start uploading and processing, as per the screenshot below. Thunor Web loads the file into its database, calculates viability and DIP rate scores, and fits dose-response curves. This may take several minutes.
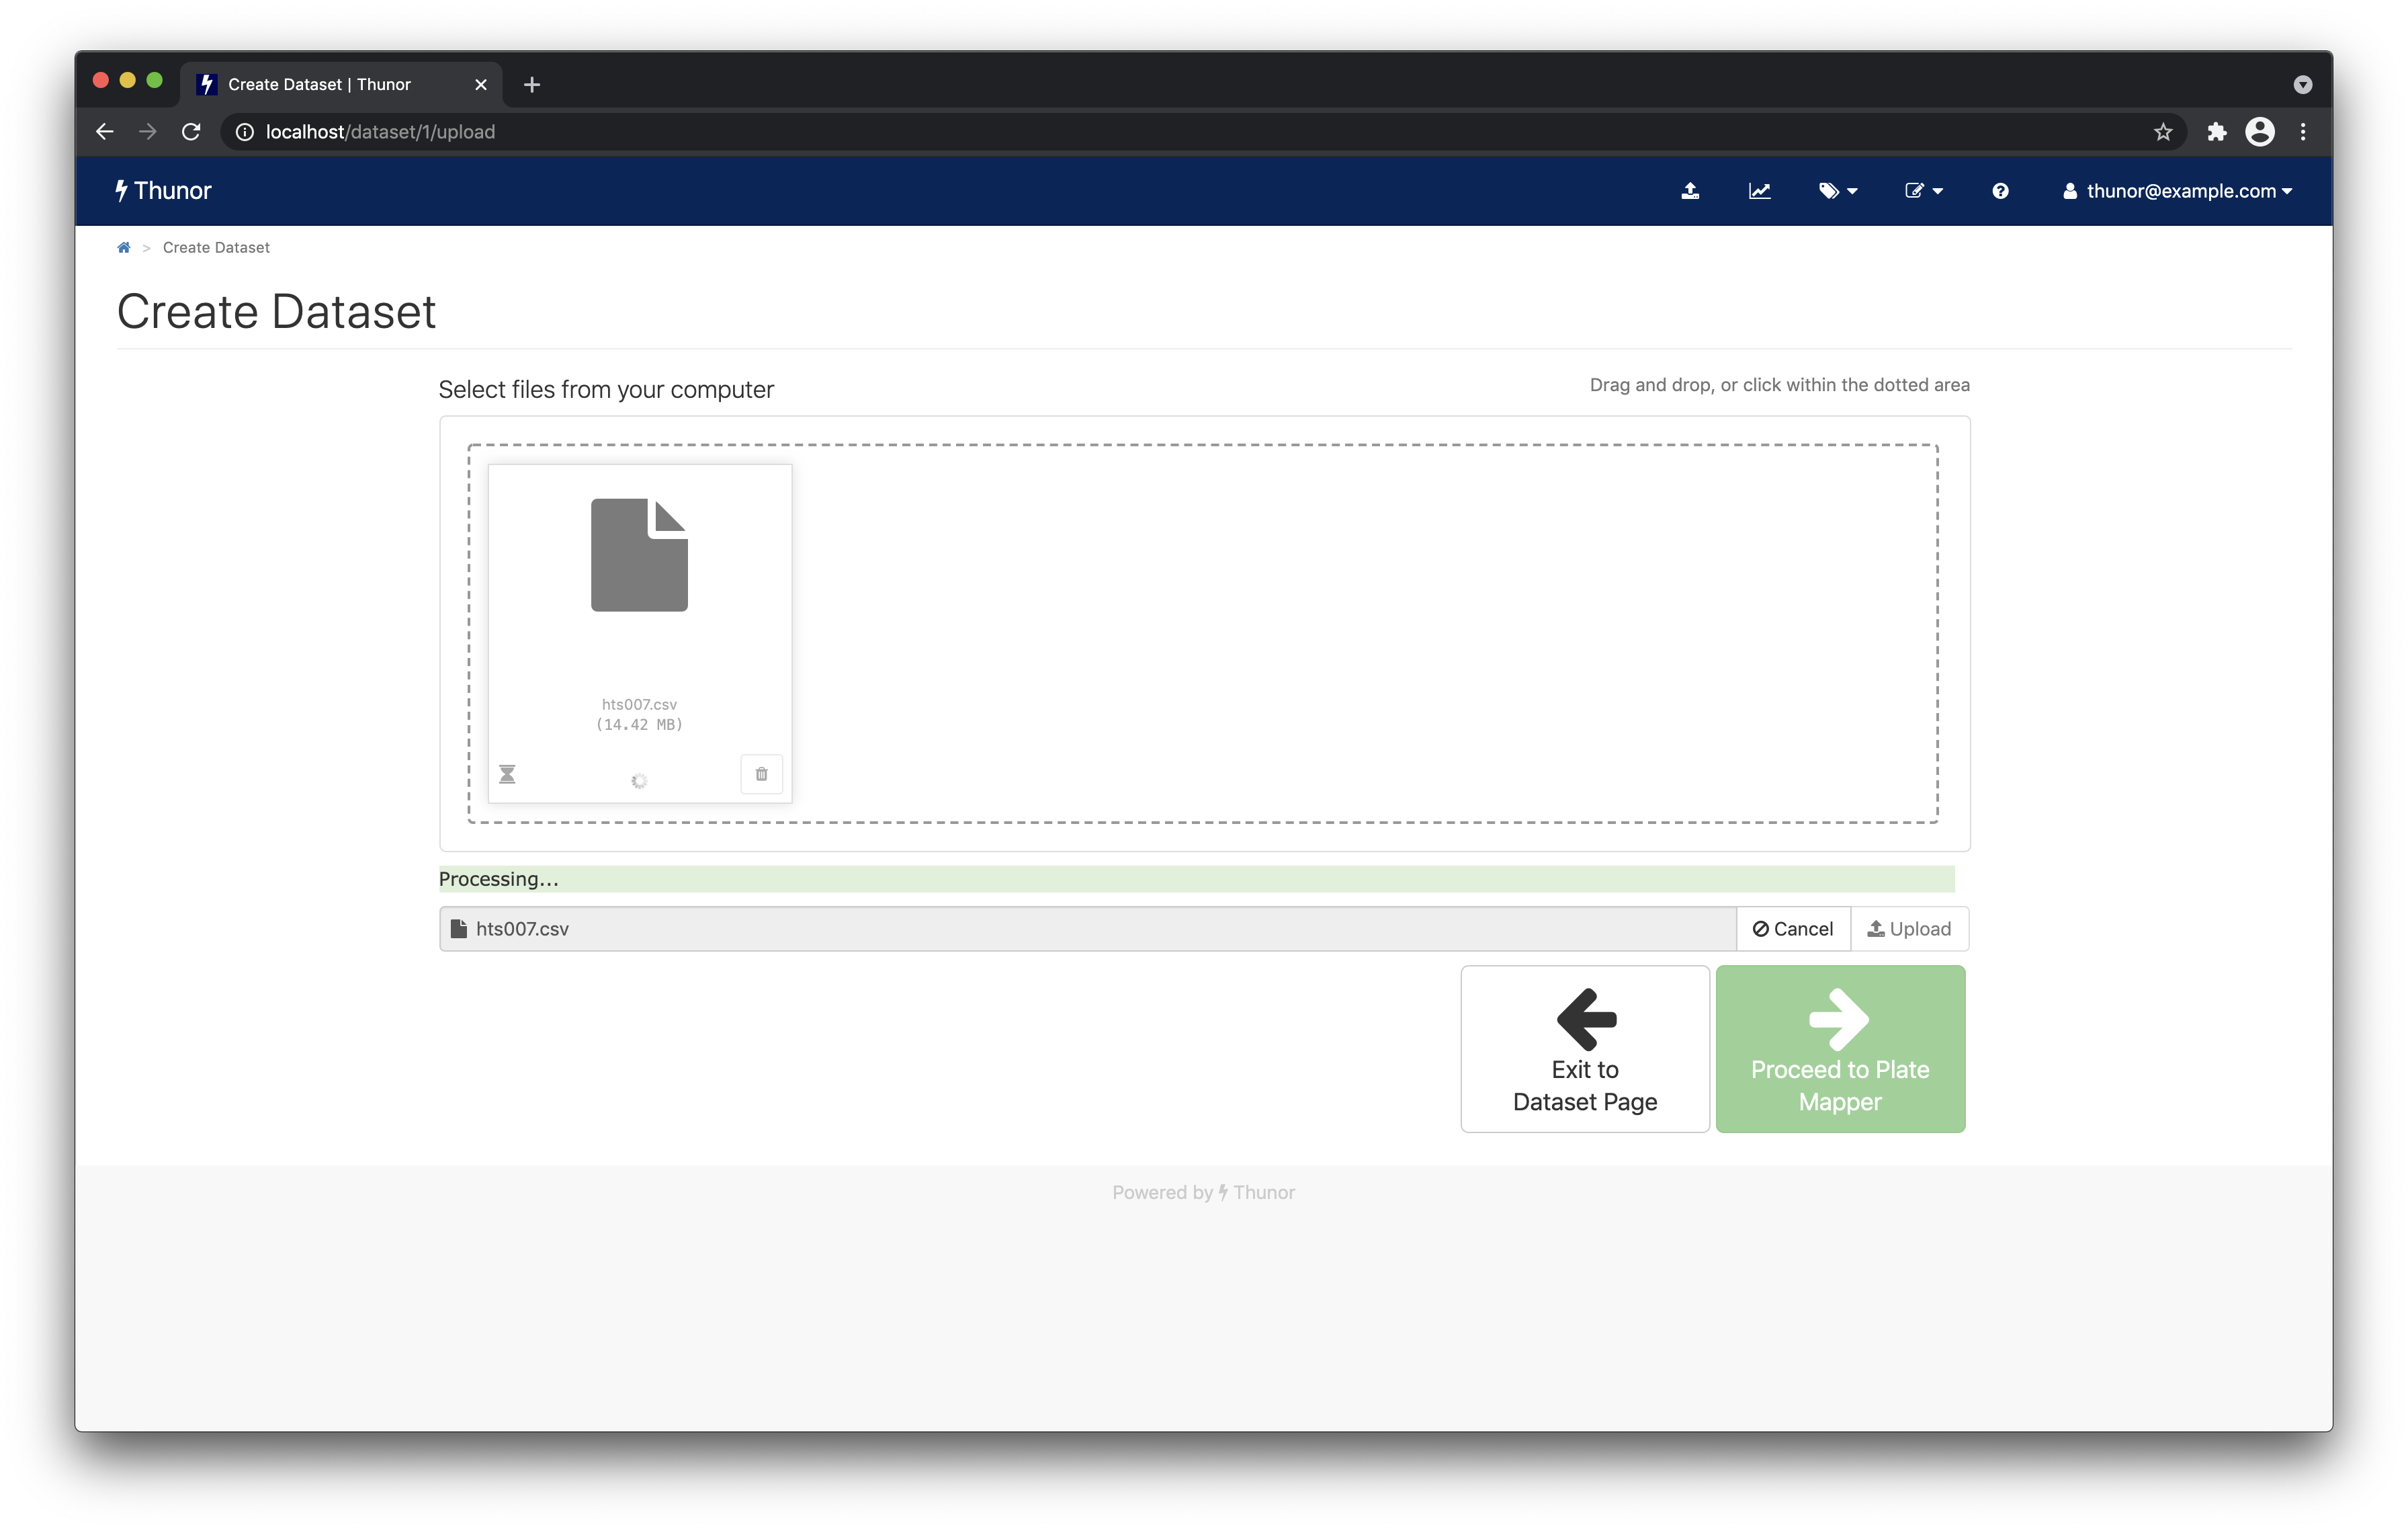 Image: Thunor Web - proecssing a dataset
When complete, you'll see a screen like the one below. Click Proceed to Plate Mapper to move onto data annotation.
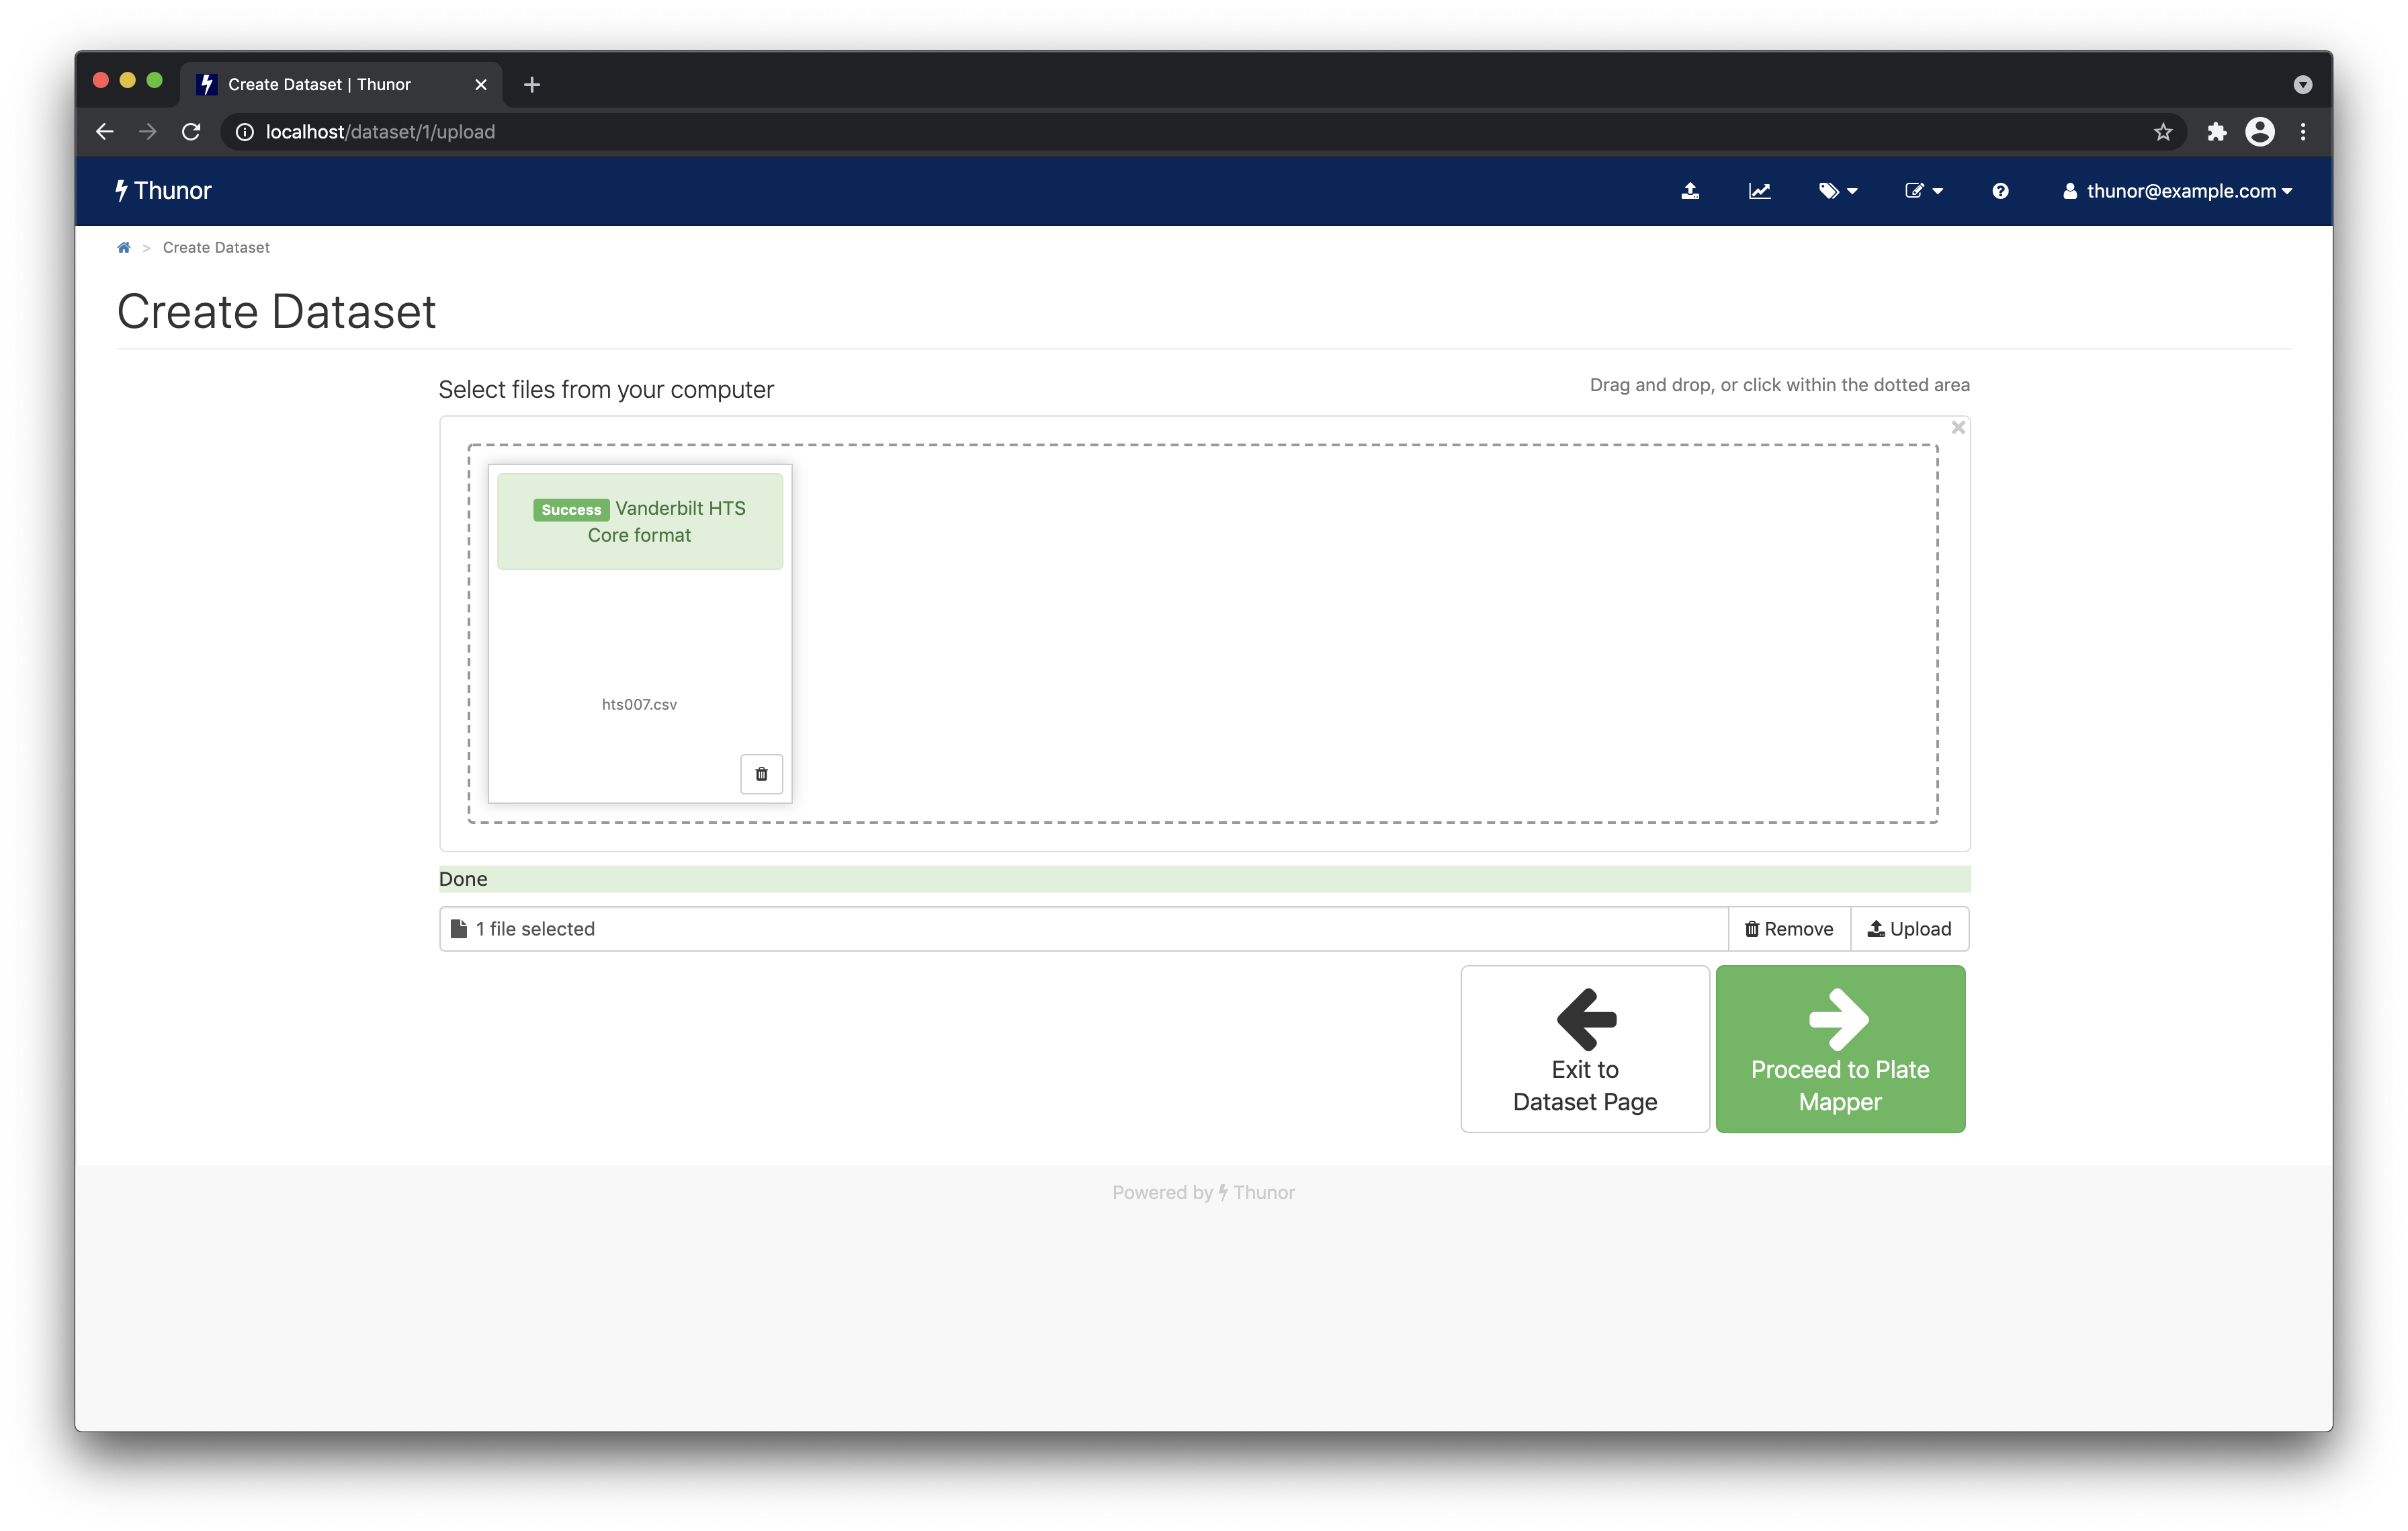 Image: Thunor Web - upload complete
View the plate maps
You should now be looking at the plate mapper, as shown below.
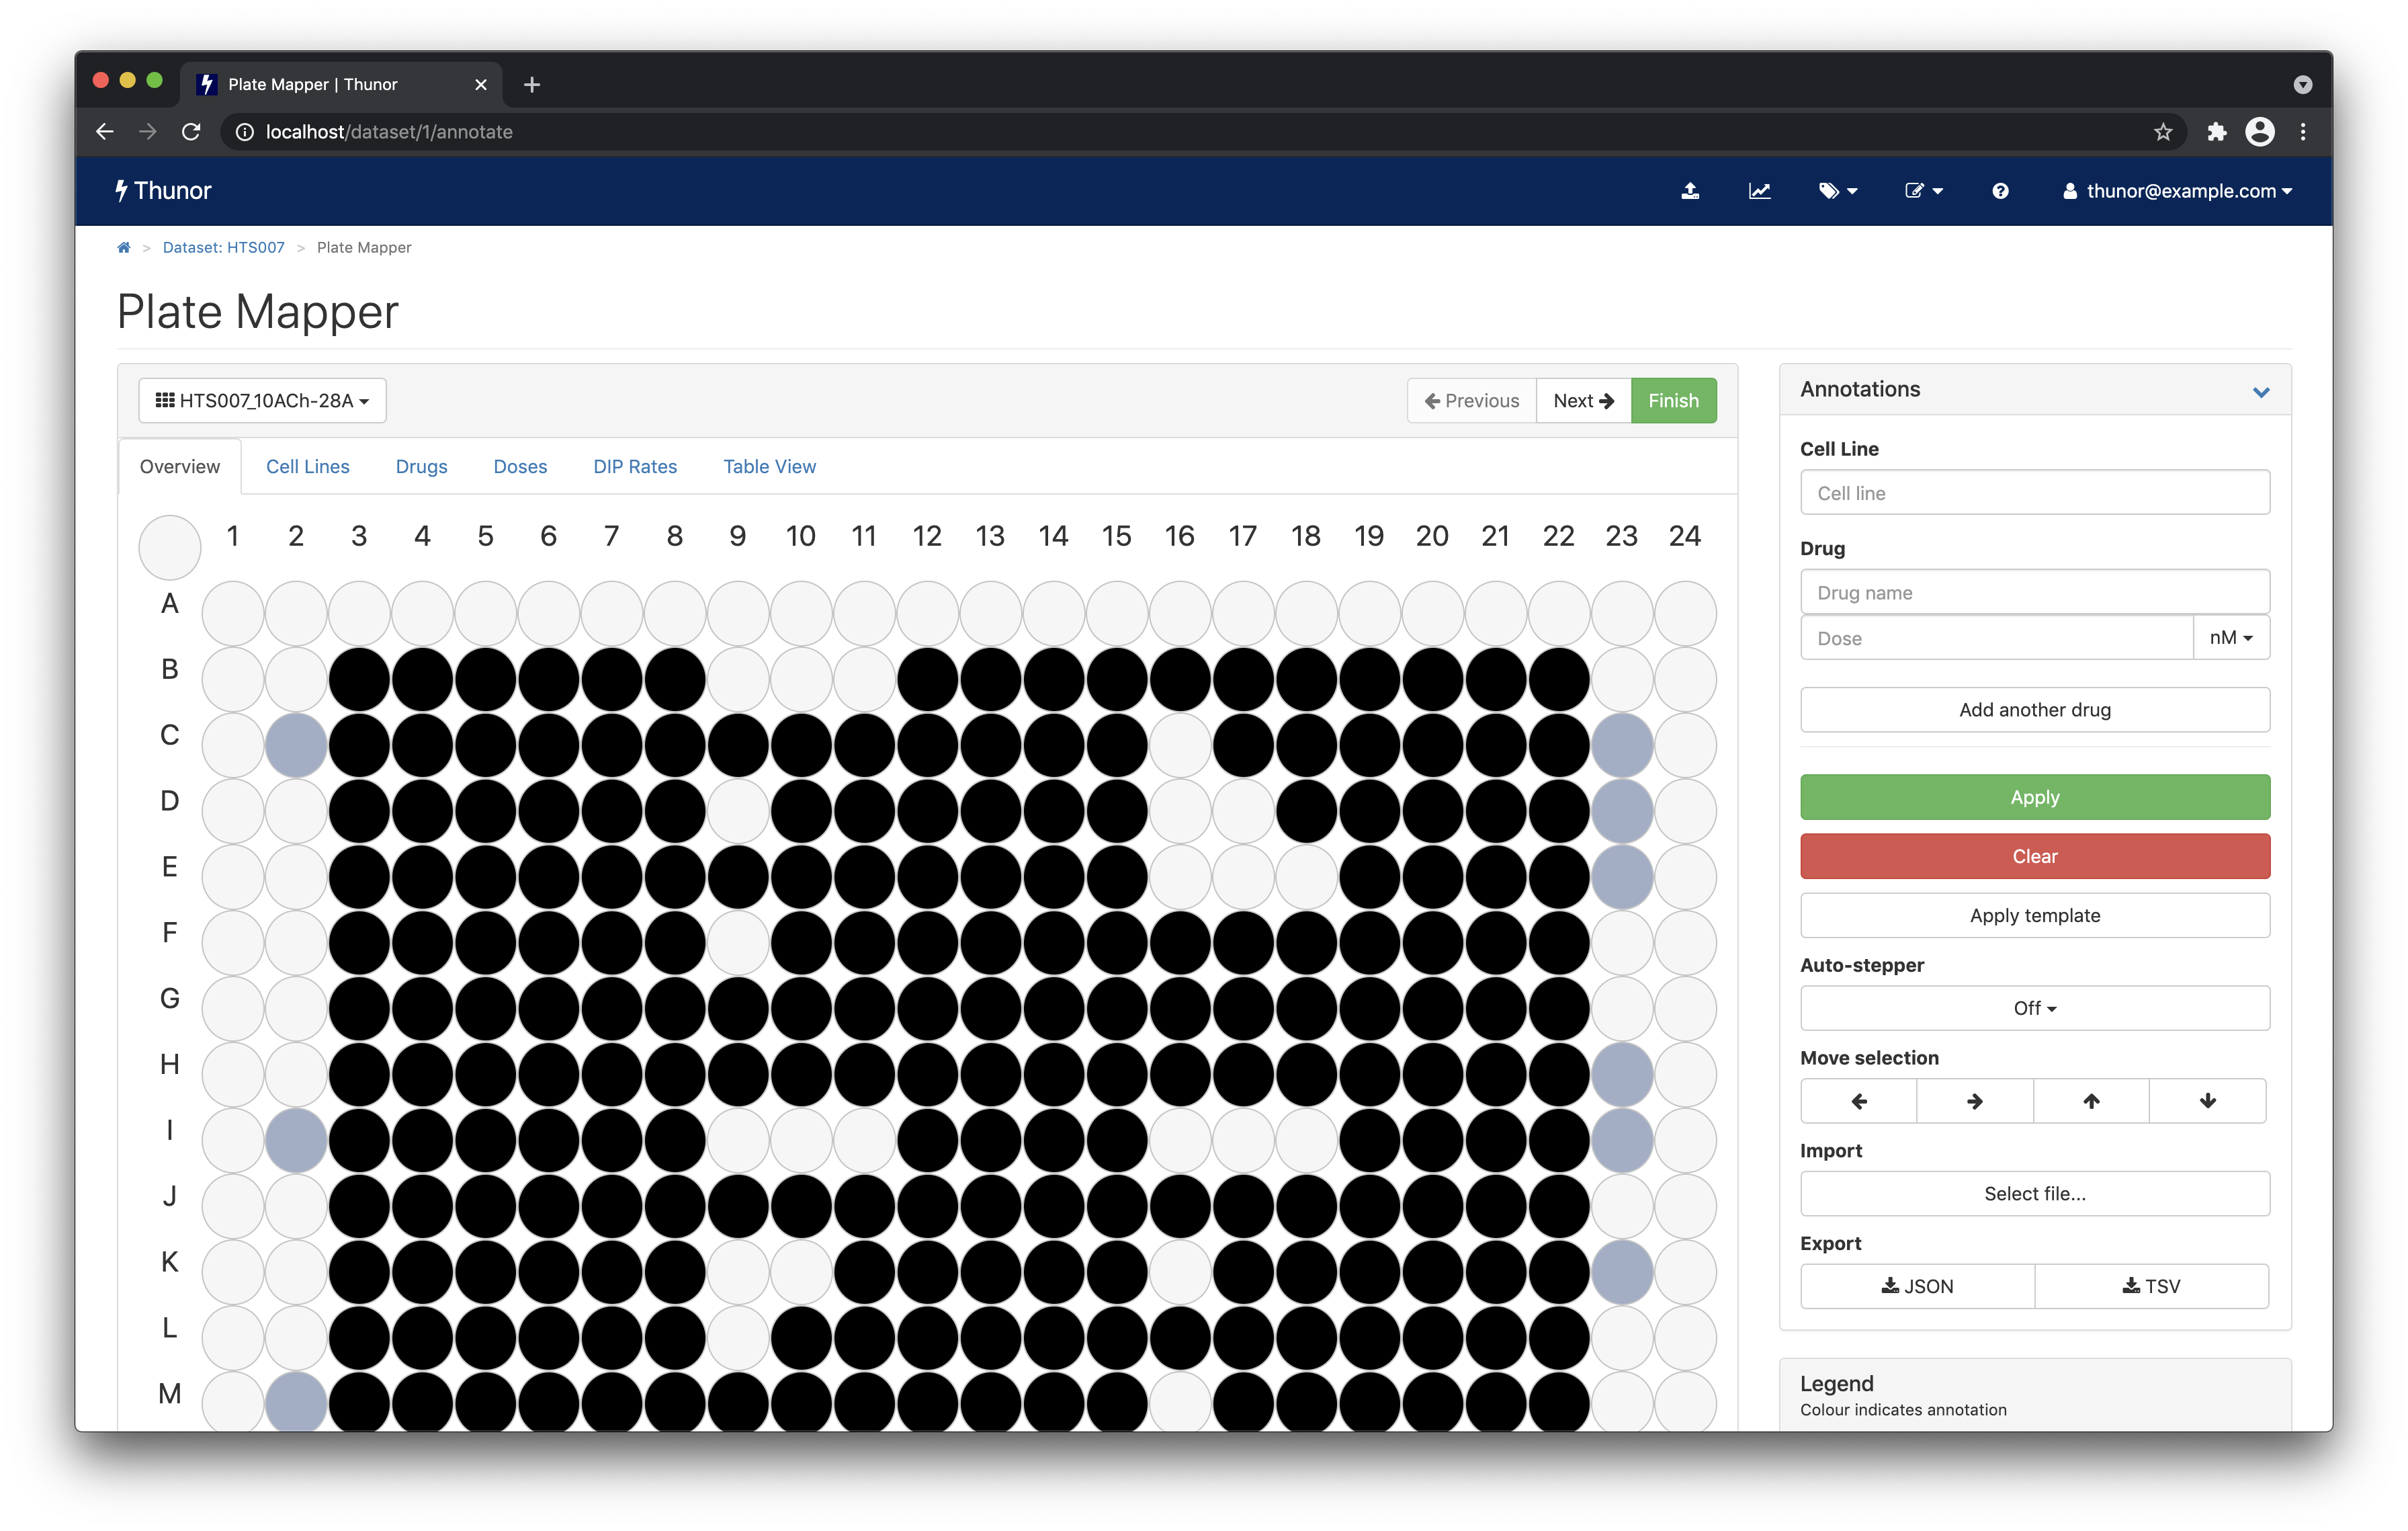 Image: Thunor Web - plate mapper
This view shows you the annotations of each multi-well plate in the dataset. In this case, the data are already pre-annotated, so there's no need to edit the data. But you can view and browse through the dataset:
- Change the plate using the drop-down box in the top left, or the next/previous buttons
- Change the view using the tabs - Overview, Cell Lines, Drugs, etc.
- Hover over a well to view its annotations
There are many other features which are useful for annotating large datasets efficiently, including templates to annotate multiple plates and once, and an "auto-stepper" for dosing concentration series. See the plate mapper documentation for further details.
When ready, move on to the dataset page by clicking Finish.
Dataset page
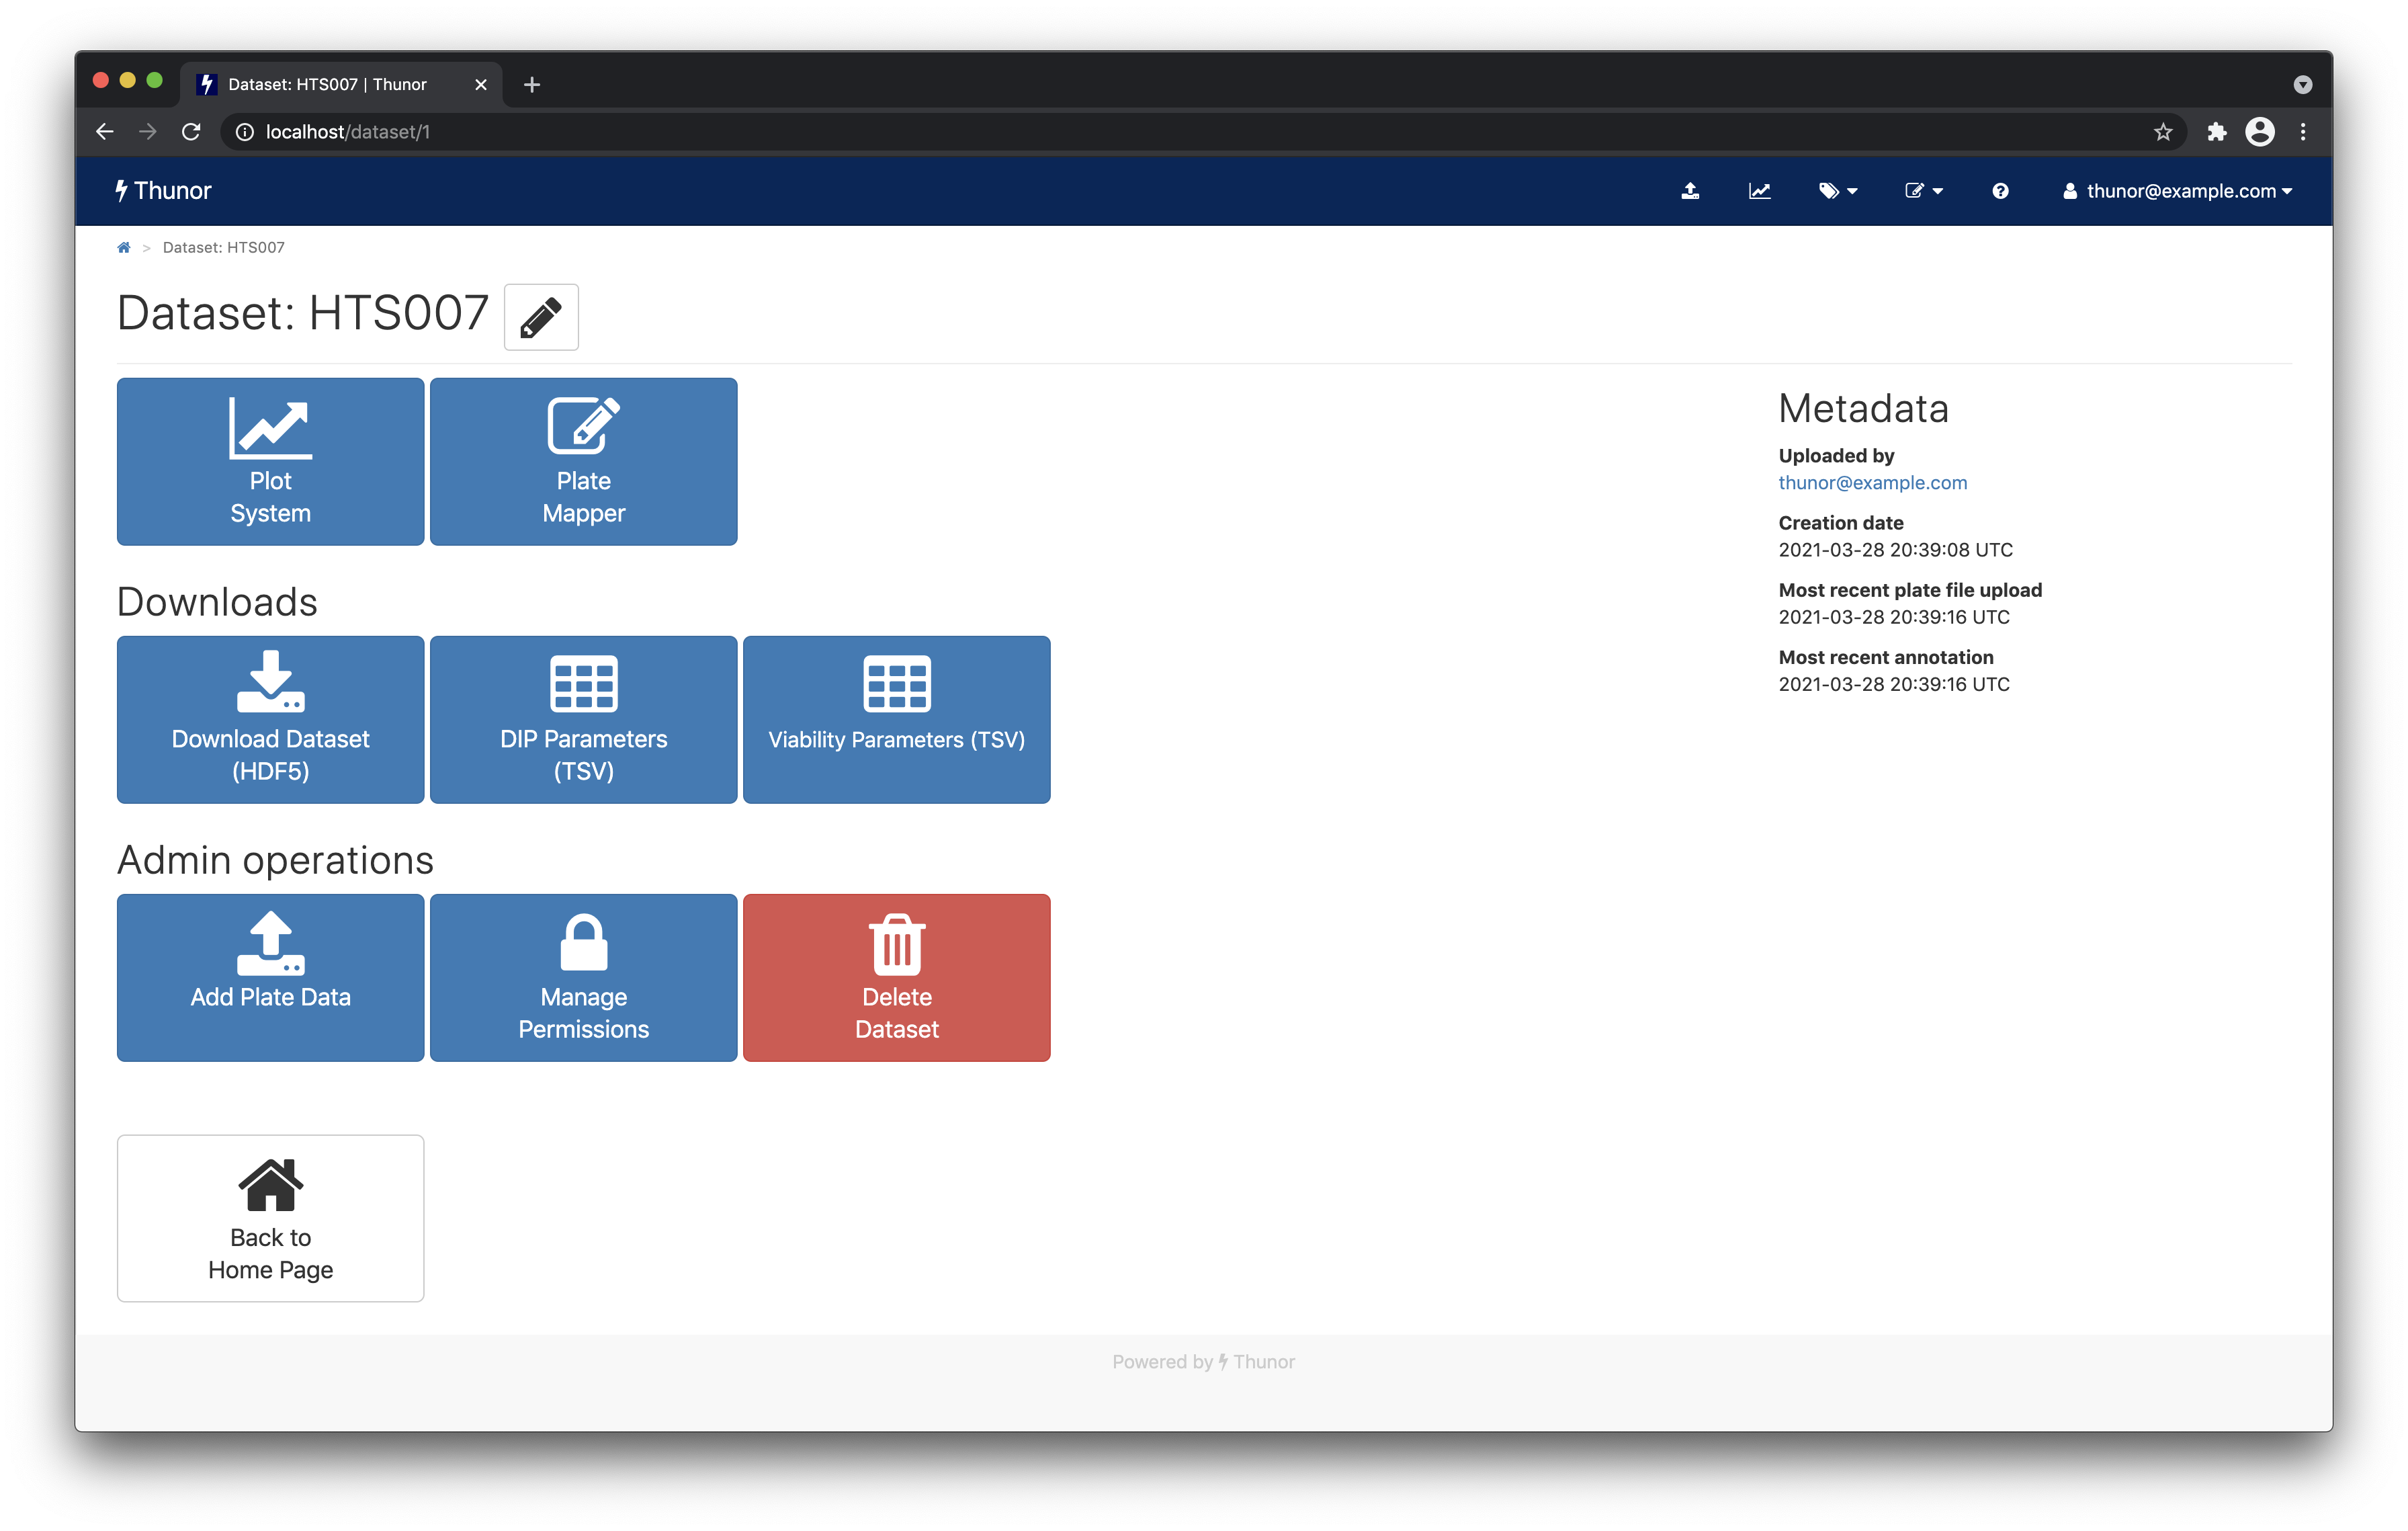 Image: Thunor Web - dataset page
The dataset page shows various tasks you can do with the dataset, including:
- The plot system, which allows interactive visualization of the dataset
- The plate mapper, covered above
- Dataset downloads, which allows datasets and derived parameters to be exported for further analysis using other tools
- Dataset permissions, to share the dataset with other user groups
Various metadata such as upload date are shown on the right.
To share a dataset with other users on the system (if this were a multi-user, networked installation), we click on Dataset Permissions, then on the new page we can toggle on and off various permissions for different user groups. For example, we could allow anyone to view plots from this dataset (screenshot below). Additional users and user groups are created in the admin interface.
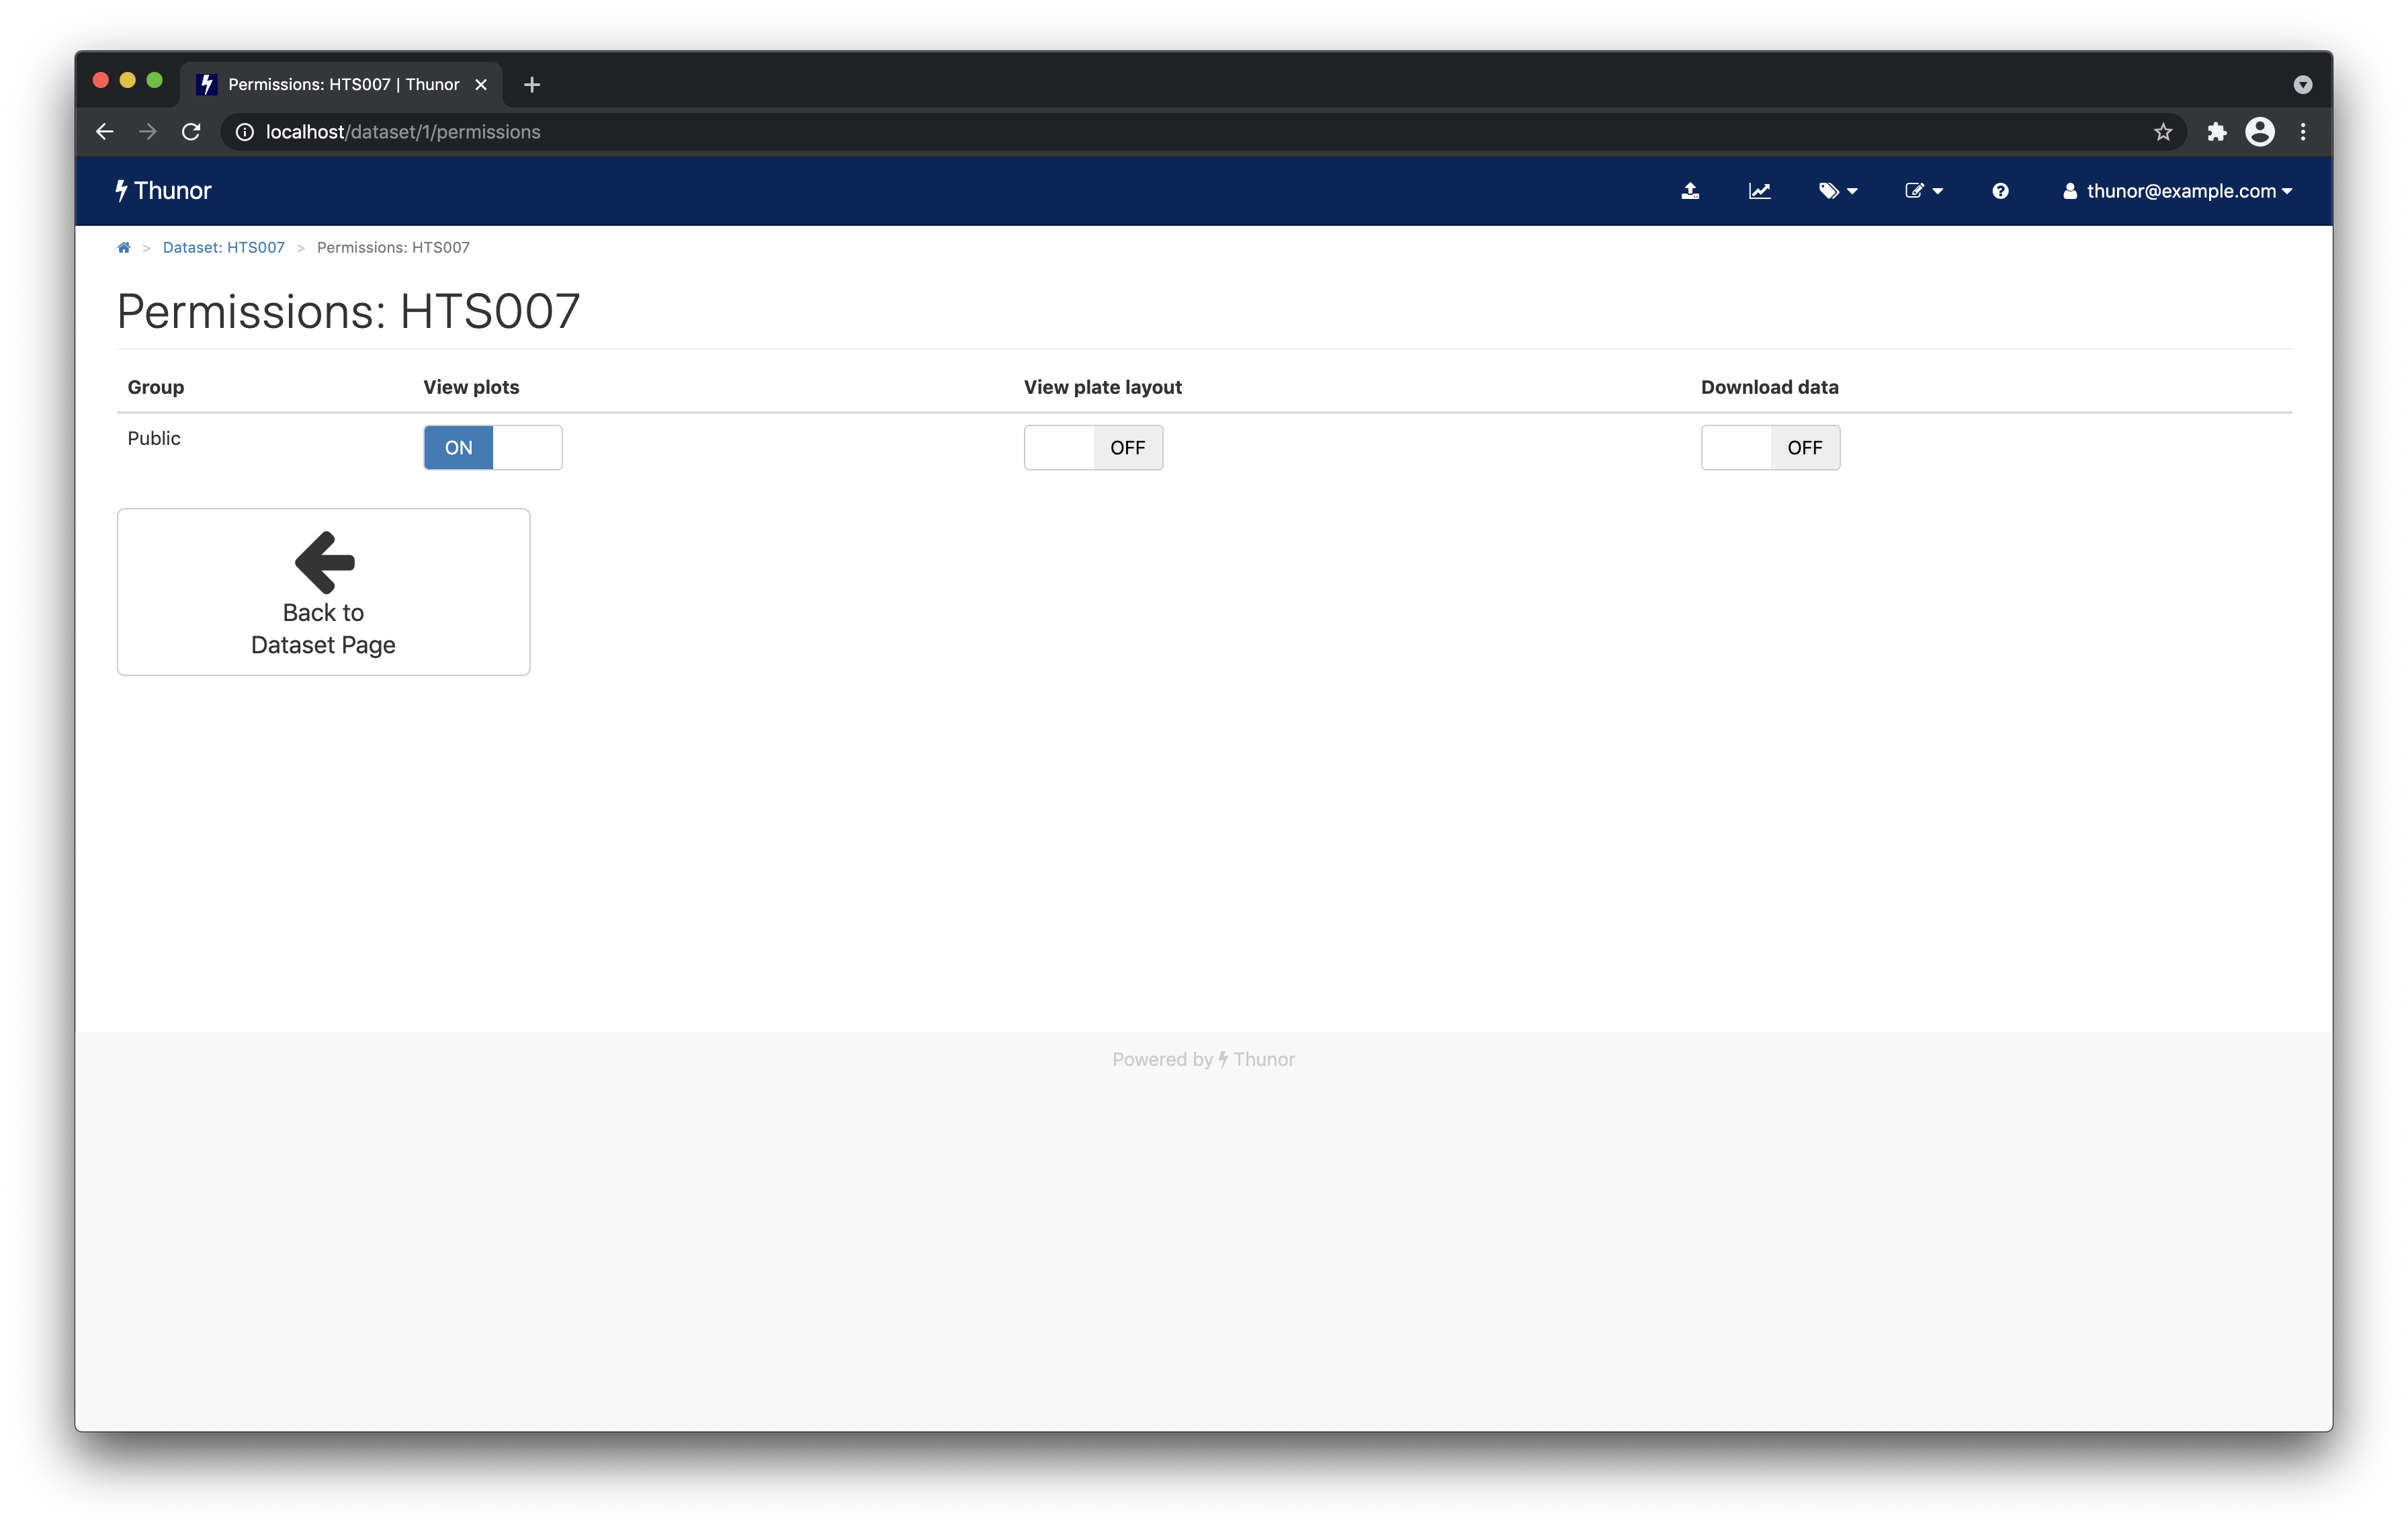 Image: Thunor Web - dataset permissions page
From the permissions page, click Back to Dataset Page.
From the dataset page, click the Plot System button.
Plot system
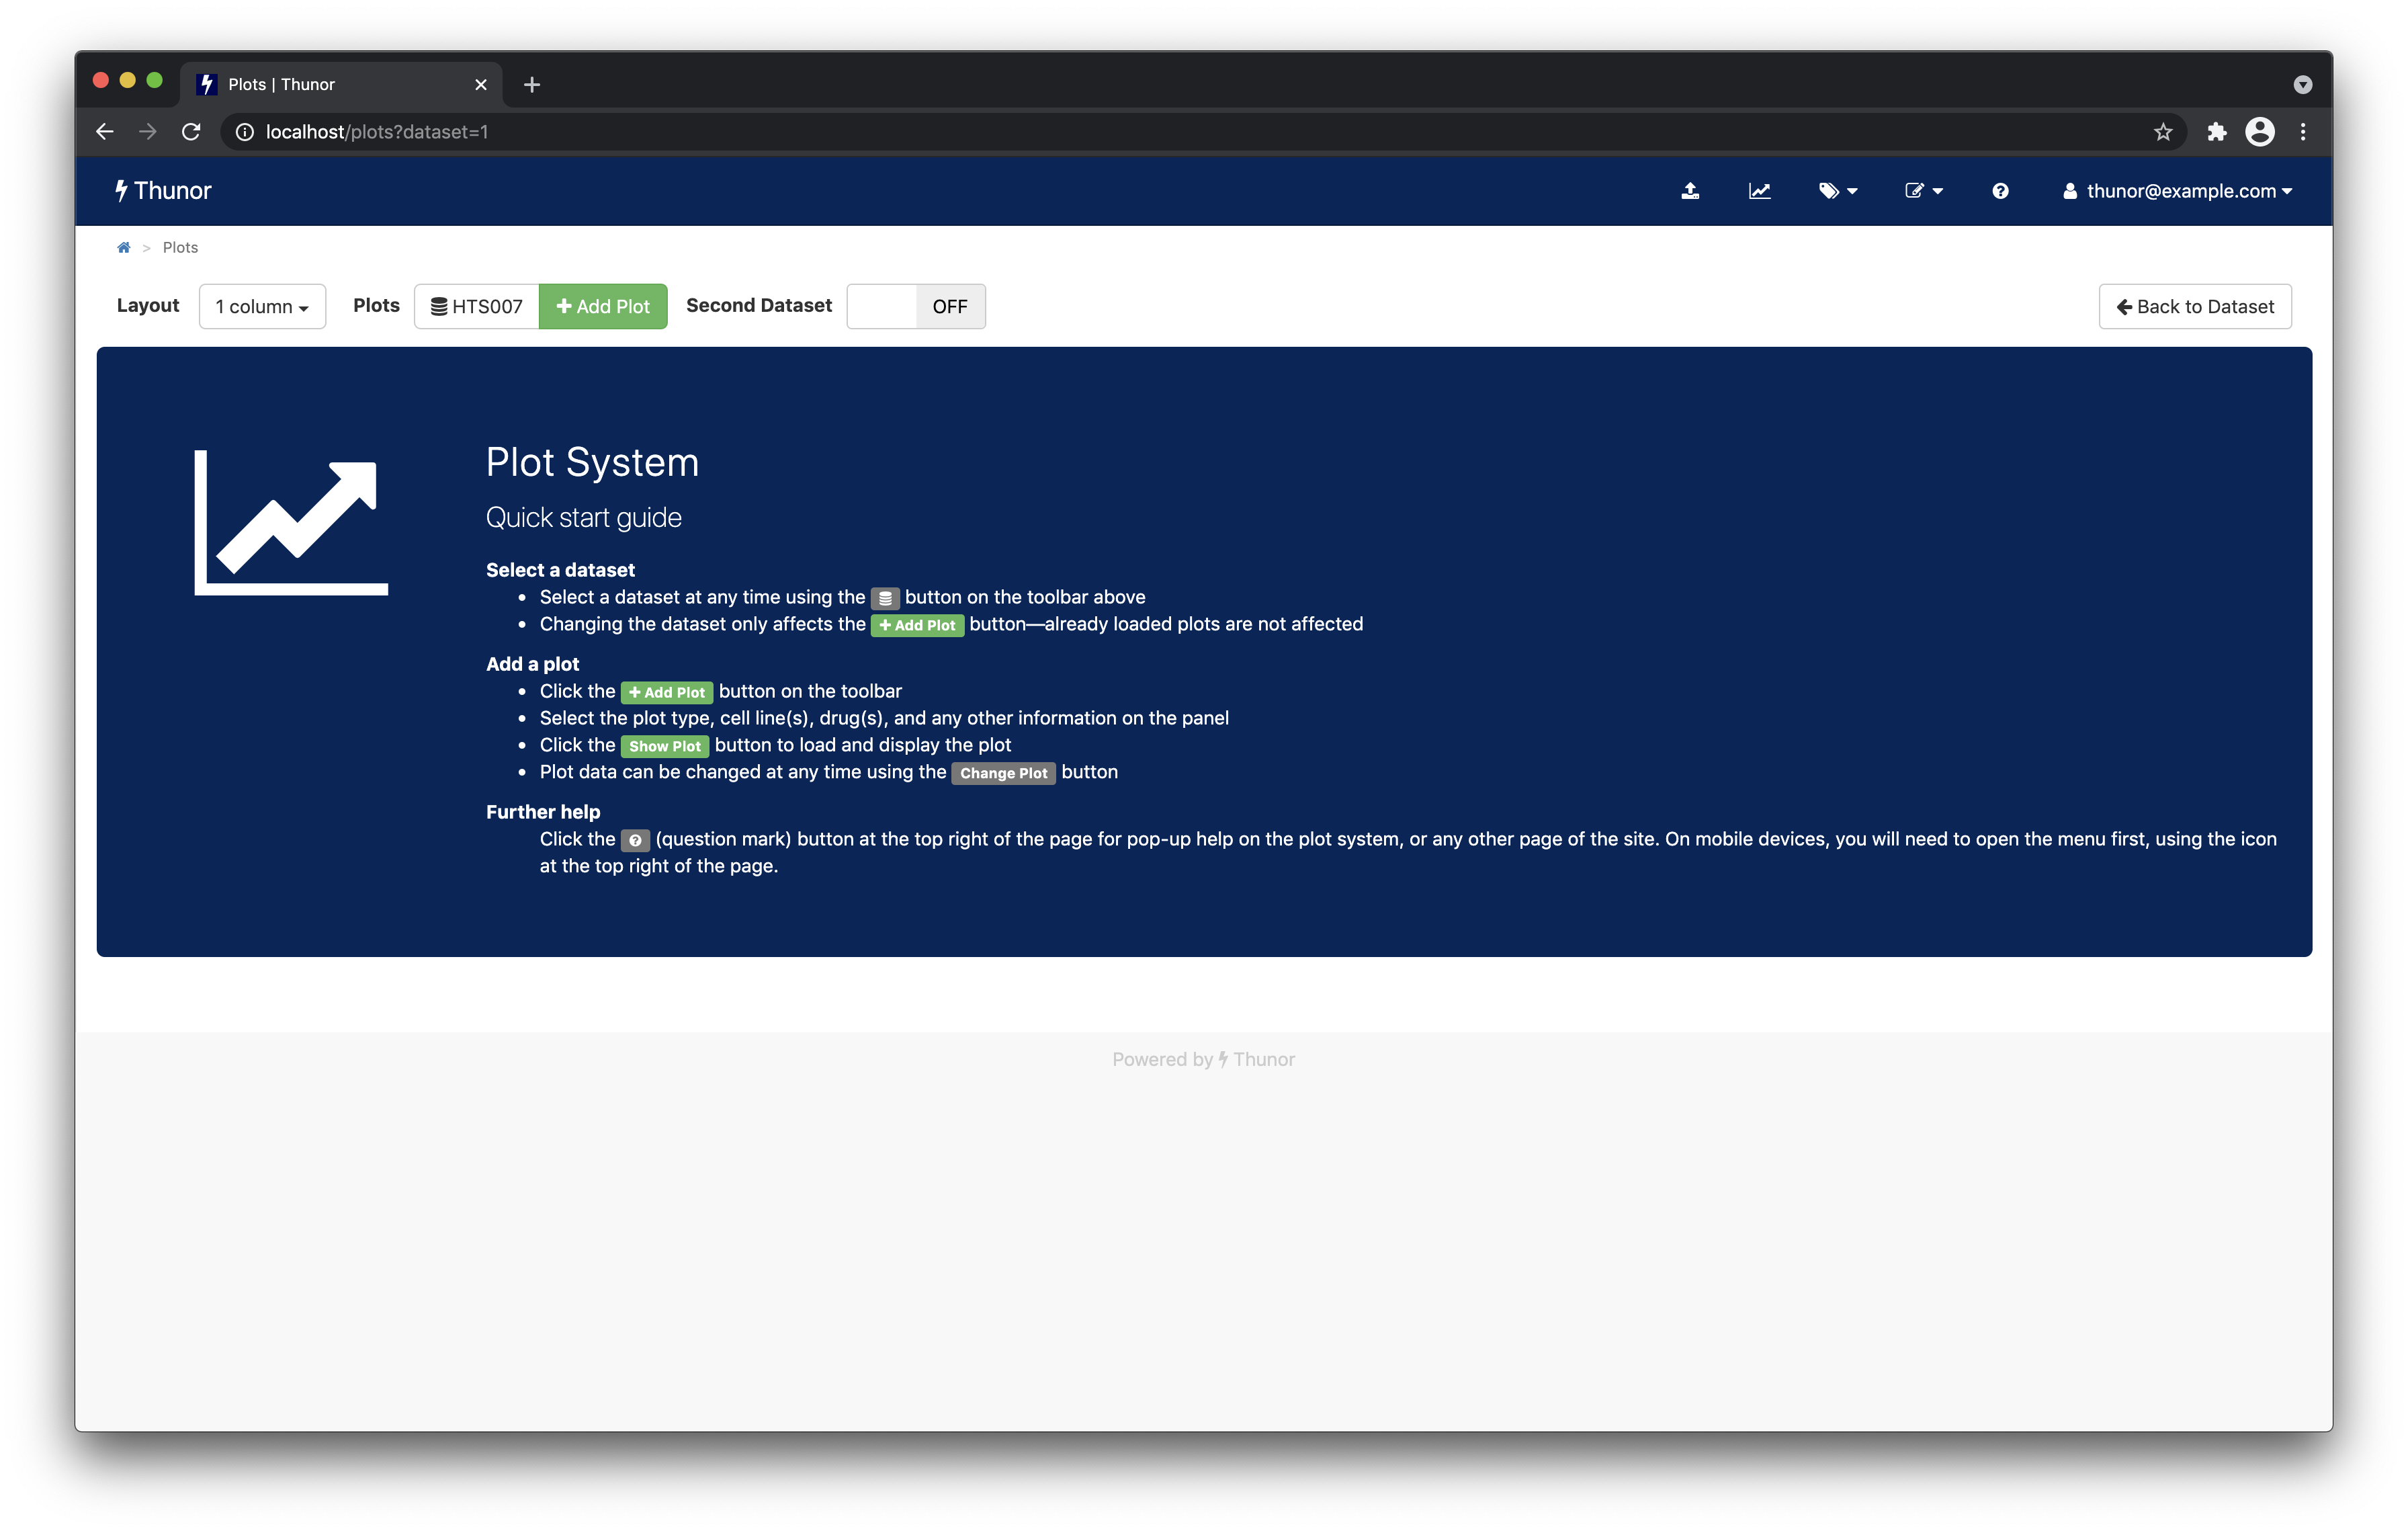 Image: Thunor Web - plot system
From the Plot System page, click Add Plot
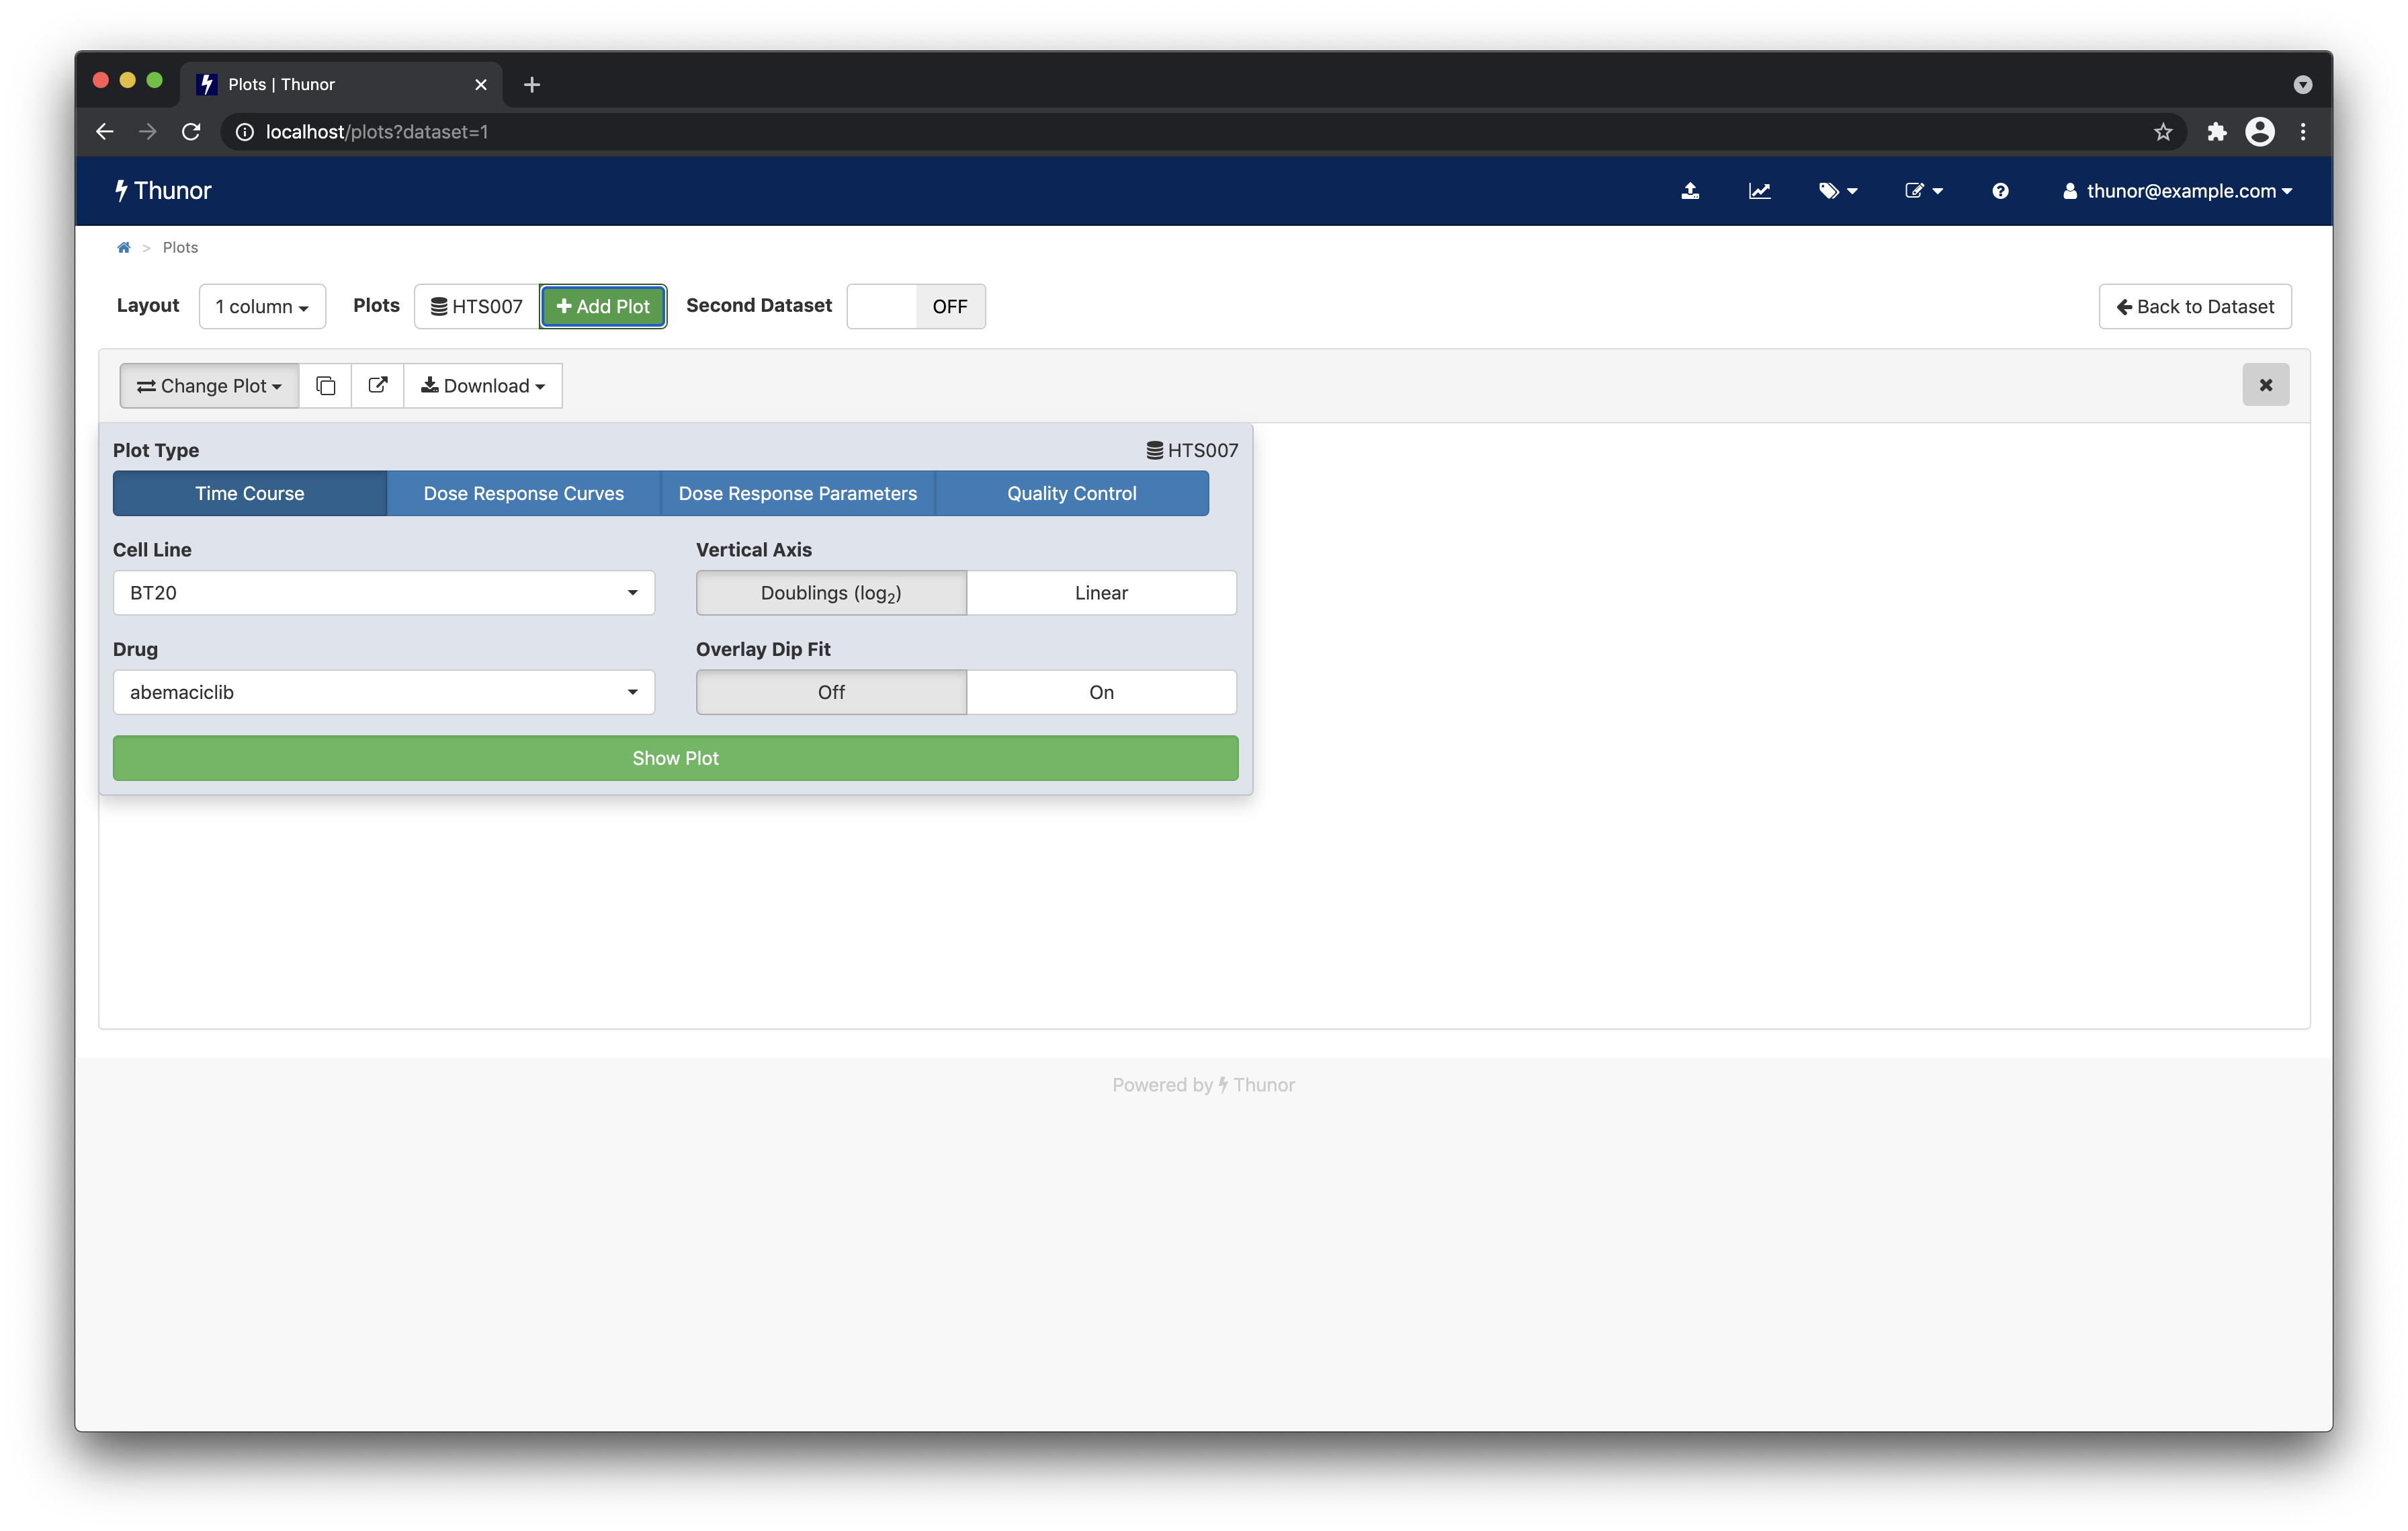 Image: Thunor Web - add plot
From this plot system, you can change the plot type and plot options. Leave these as default, and click Show Plot.
Next, change the layout to 2 column using the dropdown box in the top left. Notice how the plot resizes.
Each plot is interactive - you can hover over it to view the underlying data. A toolbar also appears on hover with options to resize the plot, zoom, pan etc. If you move over the main plot data area (cursor turns to crosshairs), and double click, you should find it auto-resizes the plot (you can also use the "Autoscale" button in the plot toolbar), giving a result similar to the screenshot below.
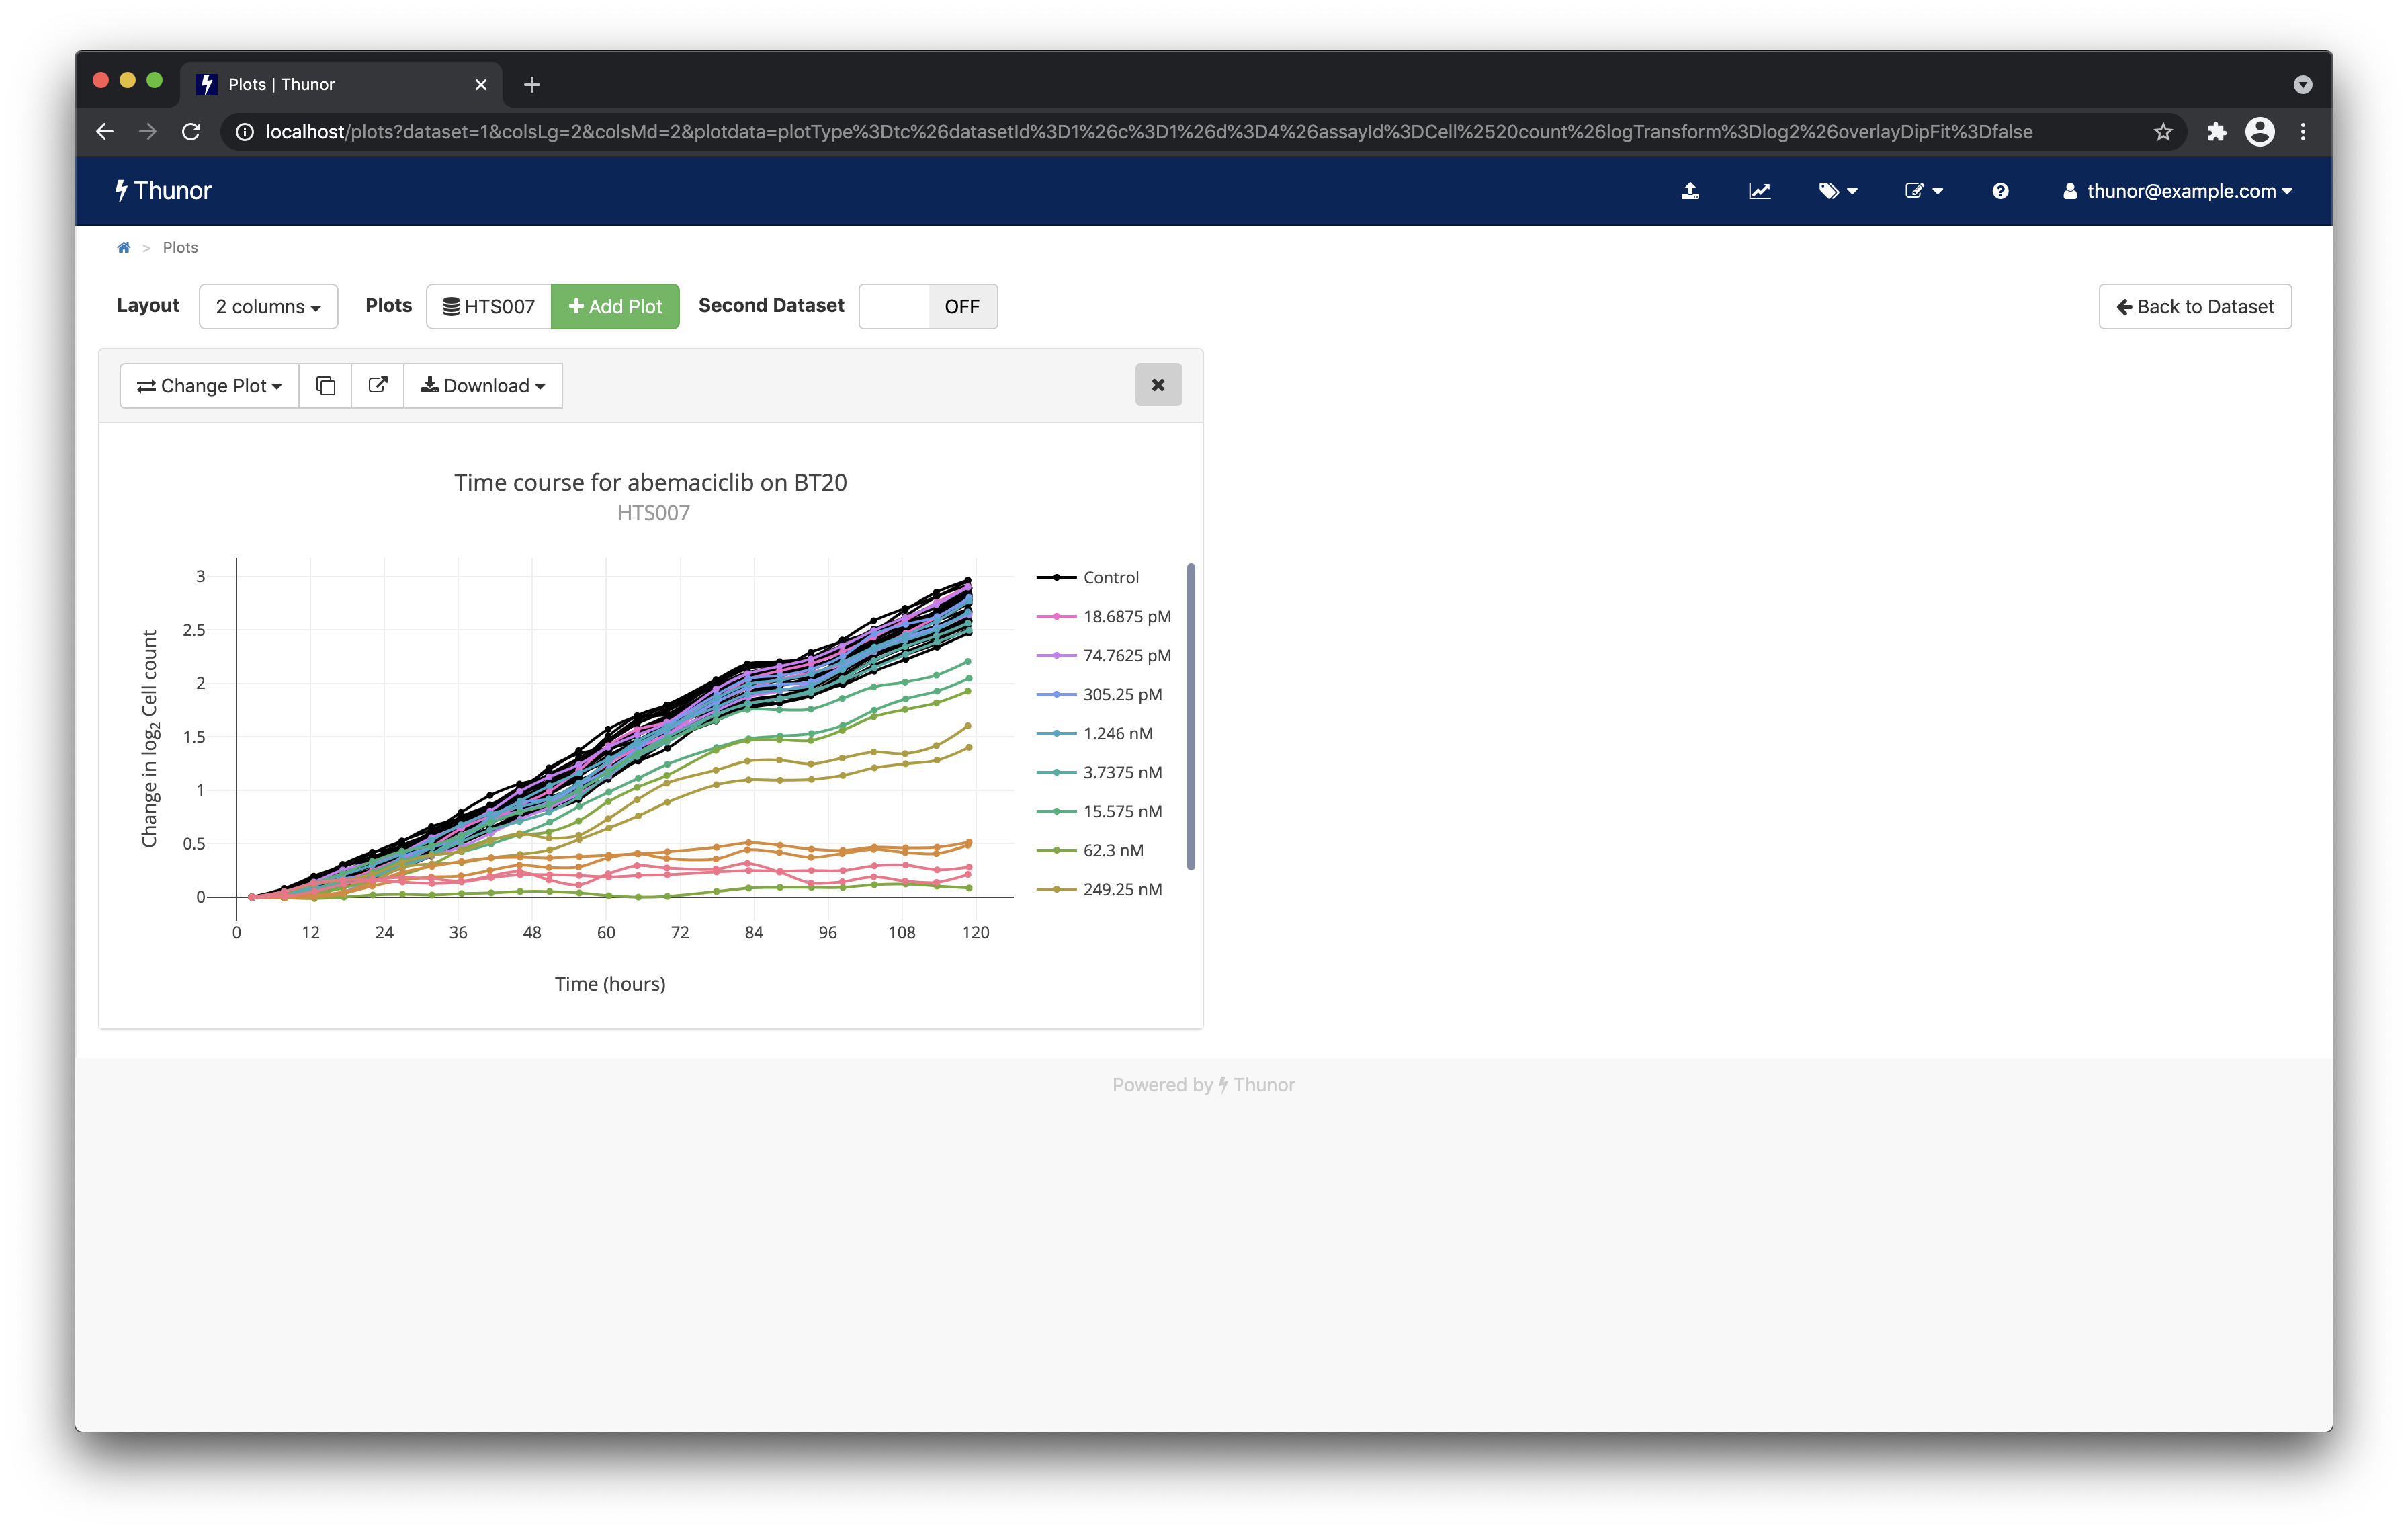 Image: Thunor Web - time course plot
To add a second plot, click Add Plot again. This time, click the Dose-response curves option, then click Show Plot. This shows a dose-response curve, with the underlying DIP rate values shown as individual data points. You can also drag and drop plots to rearrange them, by clicking on the grey header bars for each plot (outside of the buttons and "X"). We note there is one data point which looks like a possible outlier, highlighted in the screenshot below.
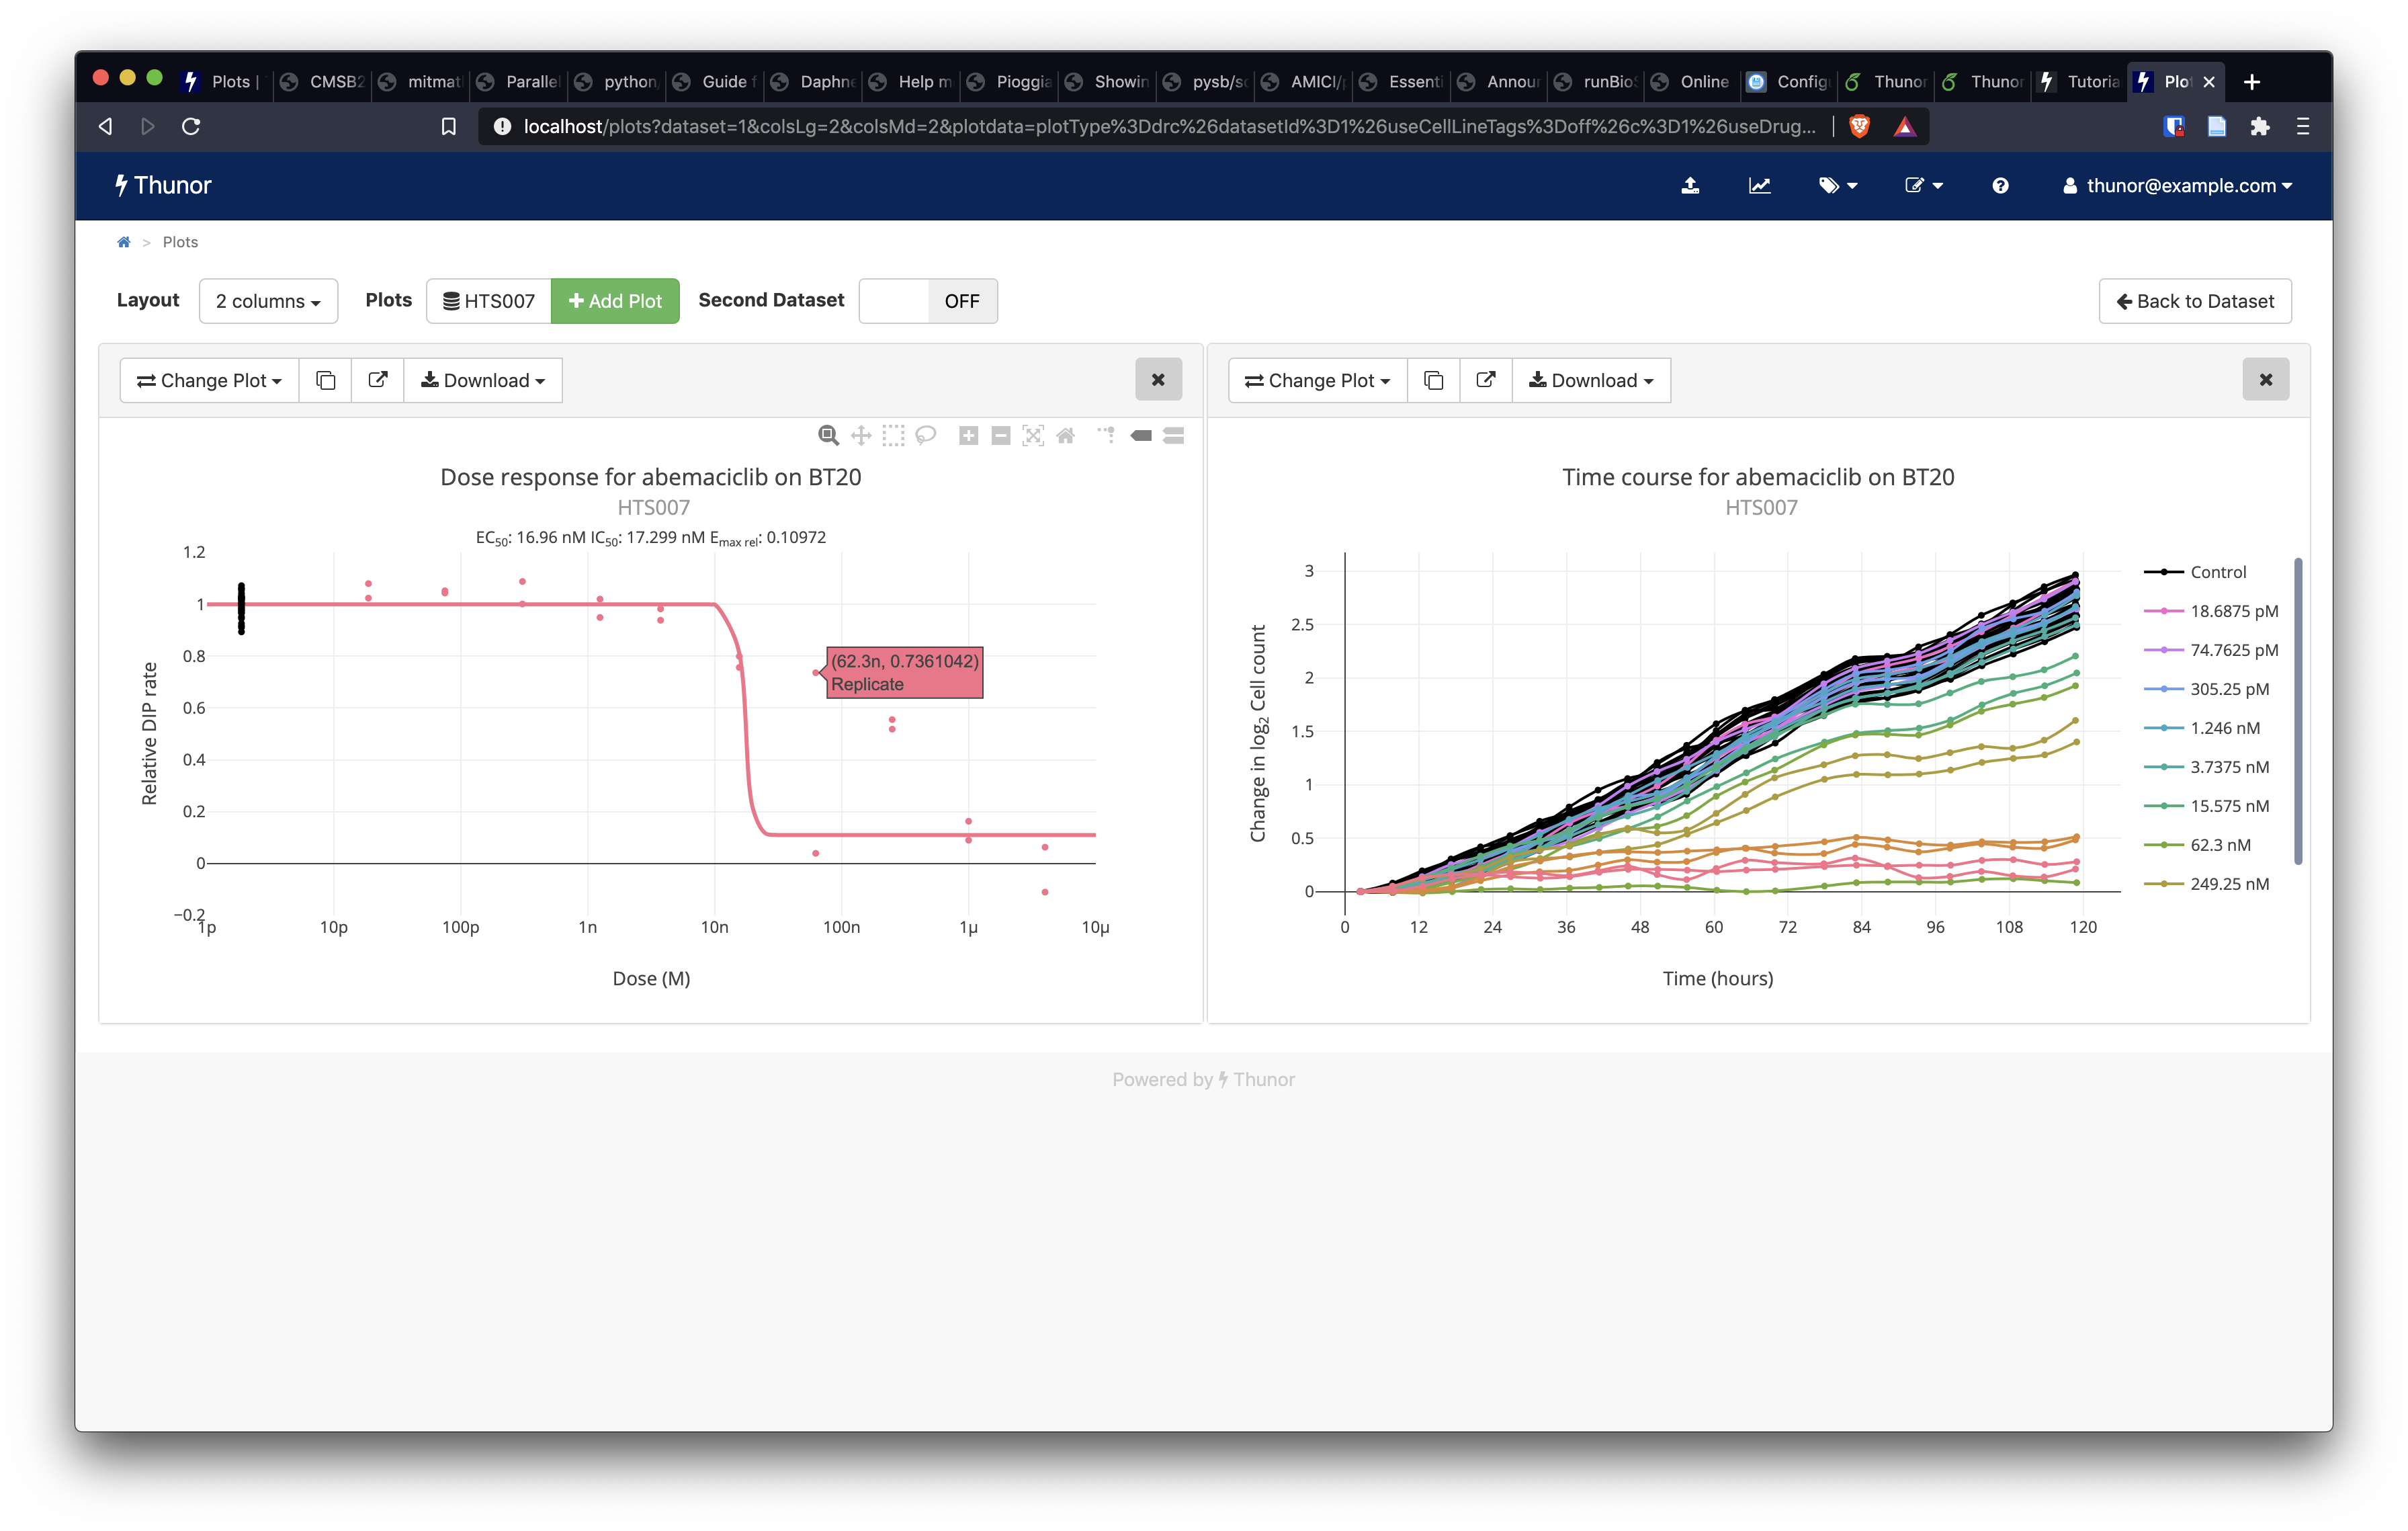 Image: Thunor Web - dose-response curve plot (left) with outlier data point highlighted
One of Thunor Web's strengths is the ability to interactively alter plots to quickly ask follow-up questions of the data. On the time-course plot, click Change Plot. In the Overlay DIP fit area, click the On button, then press Show Plot. The plot has now updated to show the fitted DIP rate values (solid, straight lines) over the raw data (dotted lines with data points). Double click the plot area to auto-resize it. In the list of concentrations on the right-hand side of the plot, click 62.3nM. This isolates the trace (shows only that concentration), as shown in the screenshot below.
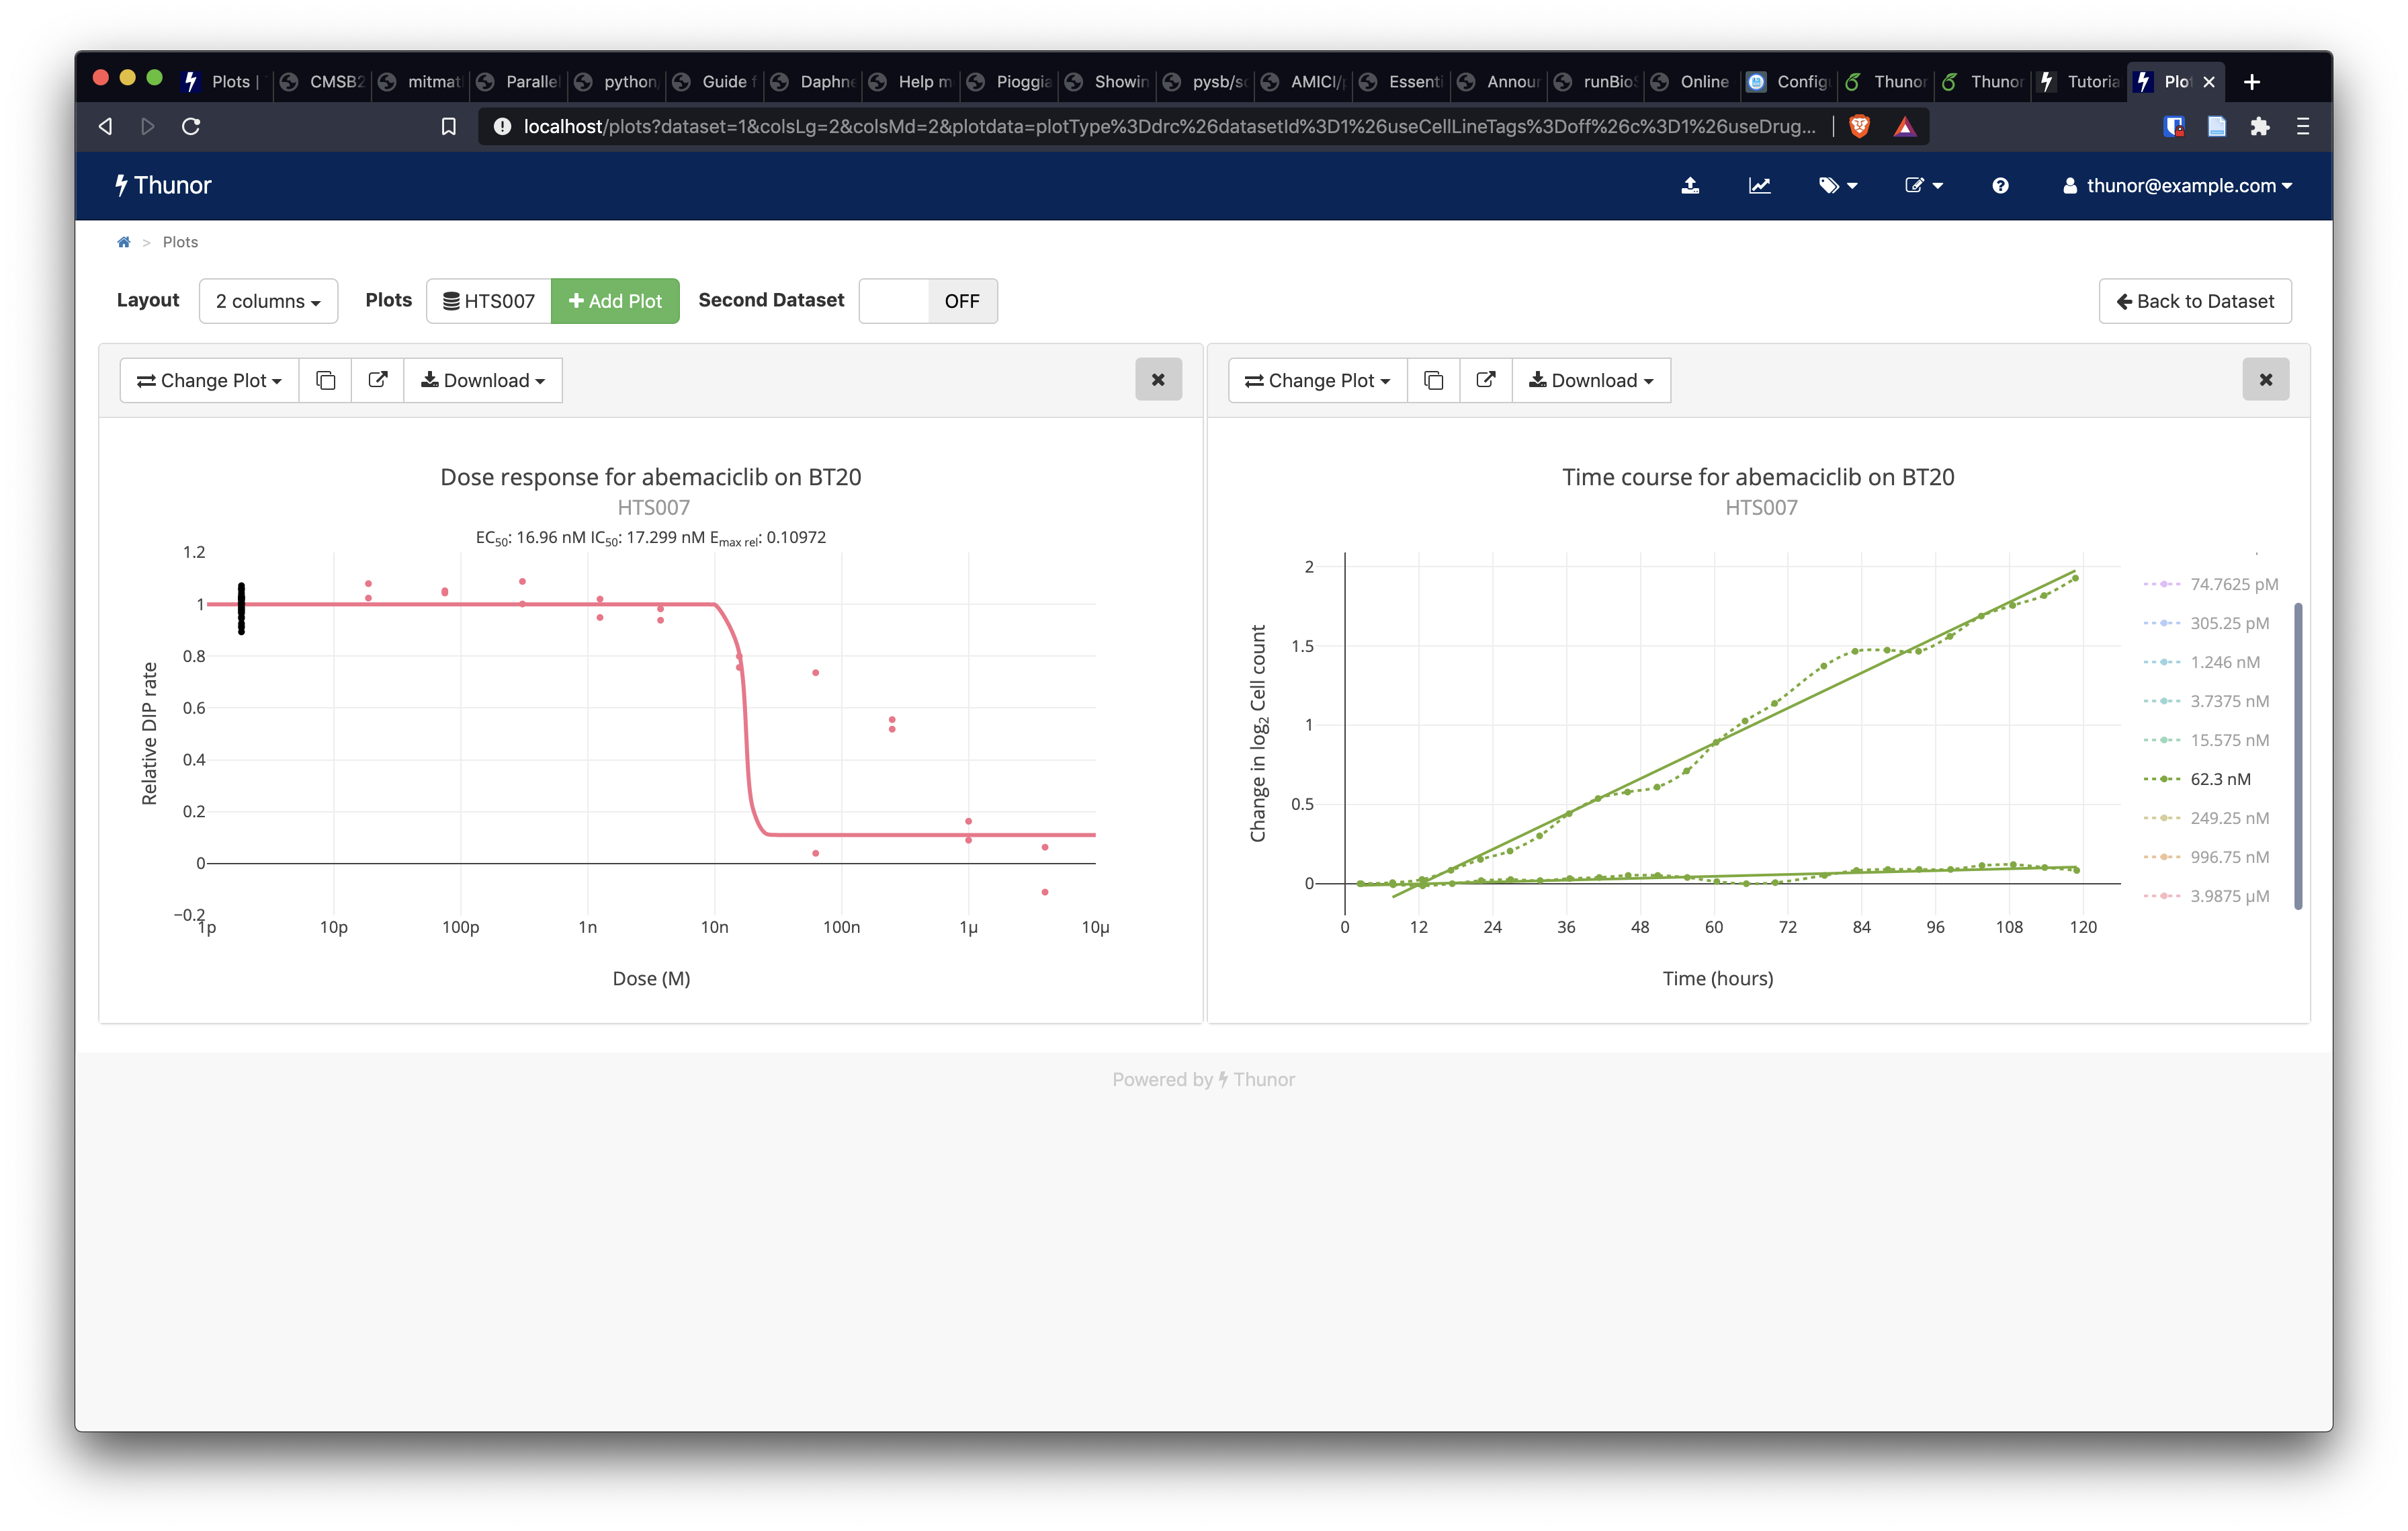 Image: Thunor Web - time-course plot with DIP rate overlay (right)
We can see that the DIP rates fit the underlying data well, but they have markedly different drug-induced proliferation rates, pointing to a possible experimental or image quantification issue with one of the wells. This is one example of how Thunor Web can be used to quickly interrogate a dataset.
There are many other plot types available and lots of options in the plot interface. We recommend reading the plot system documentation, which gives a comprehensive overview of its features.
Tag System
The tag system allows cell lines and drugs to be annotated with categorical labels, which can be used to group them in plots and for statistical analysis. This is most useful on larger datasets, so we recommend viewing our demo site, which has been preloaded with the Genomics of Drug Sensitivity in Cancer (GDSC) dataset and some related cell line tags and drug tags.
Here, we'll briefly show how to create some tags in Thunor Web. You can download some example cell line tags (CSV format) from this site. The format is covered in the tag system documentation.
From the home page, click the Cell line tags button.
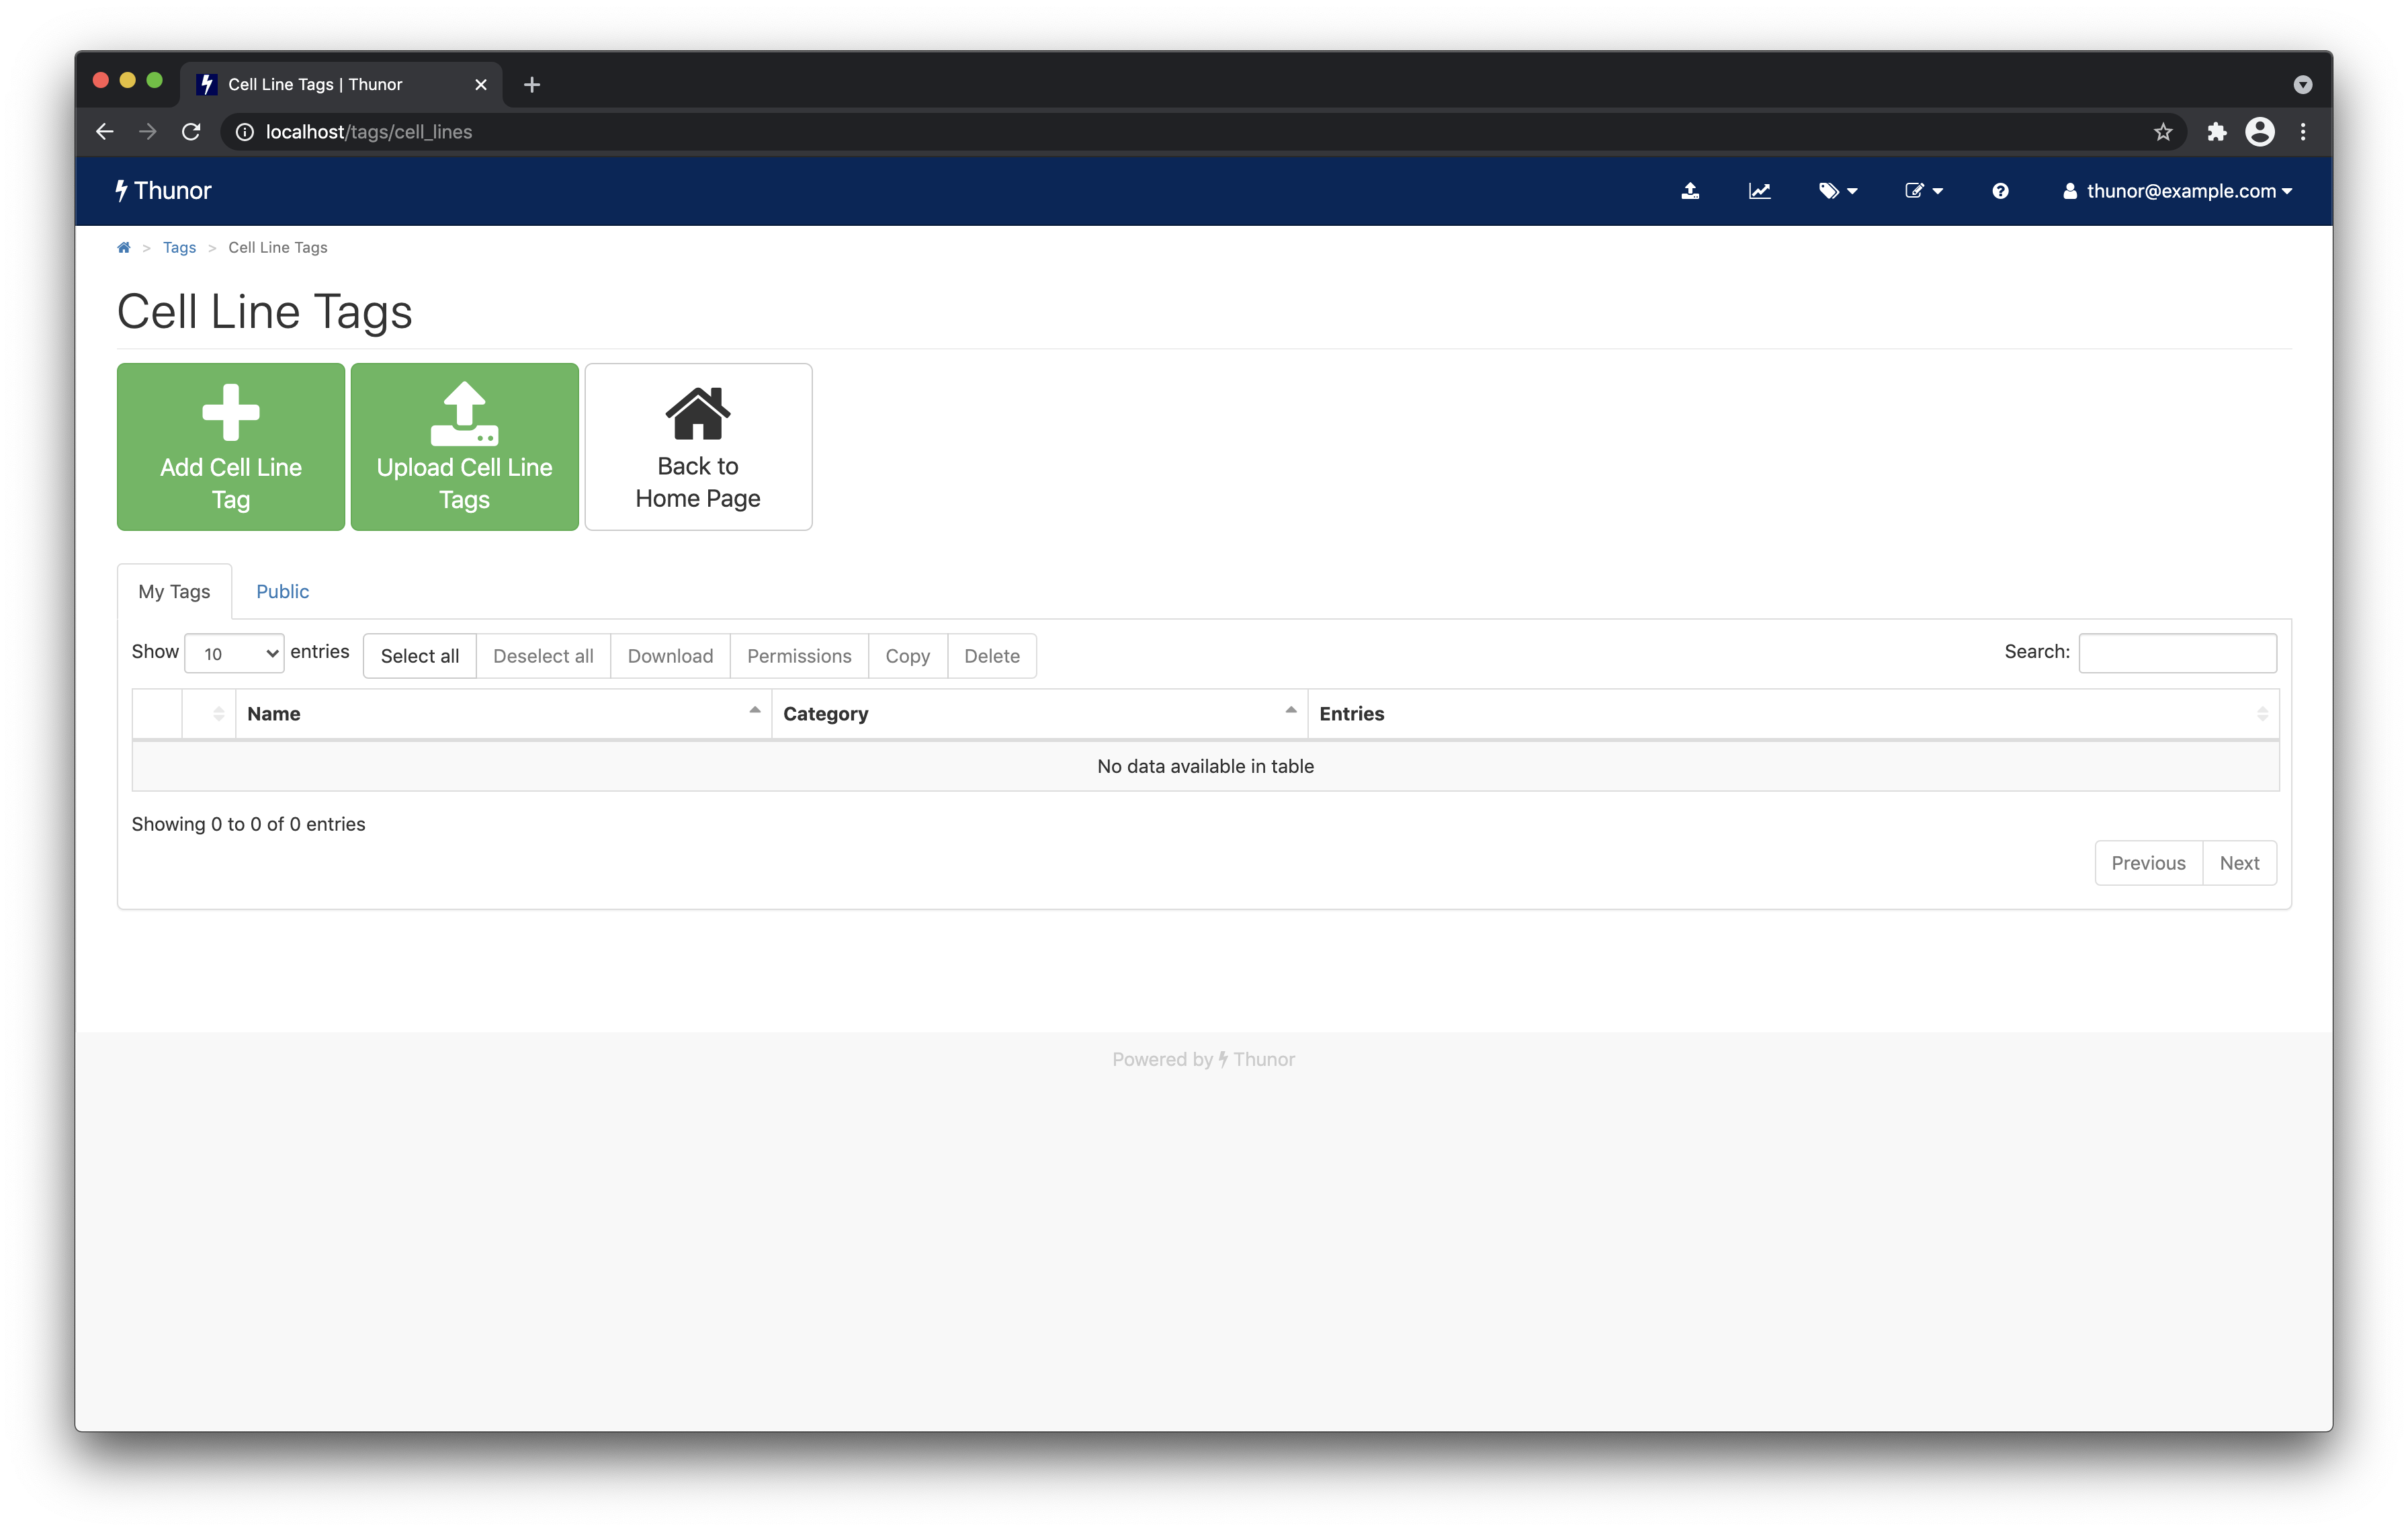 Image: Thunor Web - cell line tags page
Next, click Upload Cell Line Tags. Toggle the Create cell lines if required switch to on by clicking it. Then, drag and drop or browse for the exmaple cell line tags CSV file you downloaded. The tags will be created automatically and the page should refresh in few moments to look the one below.
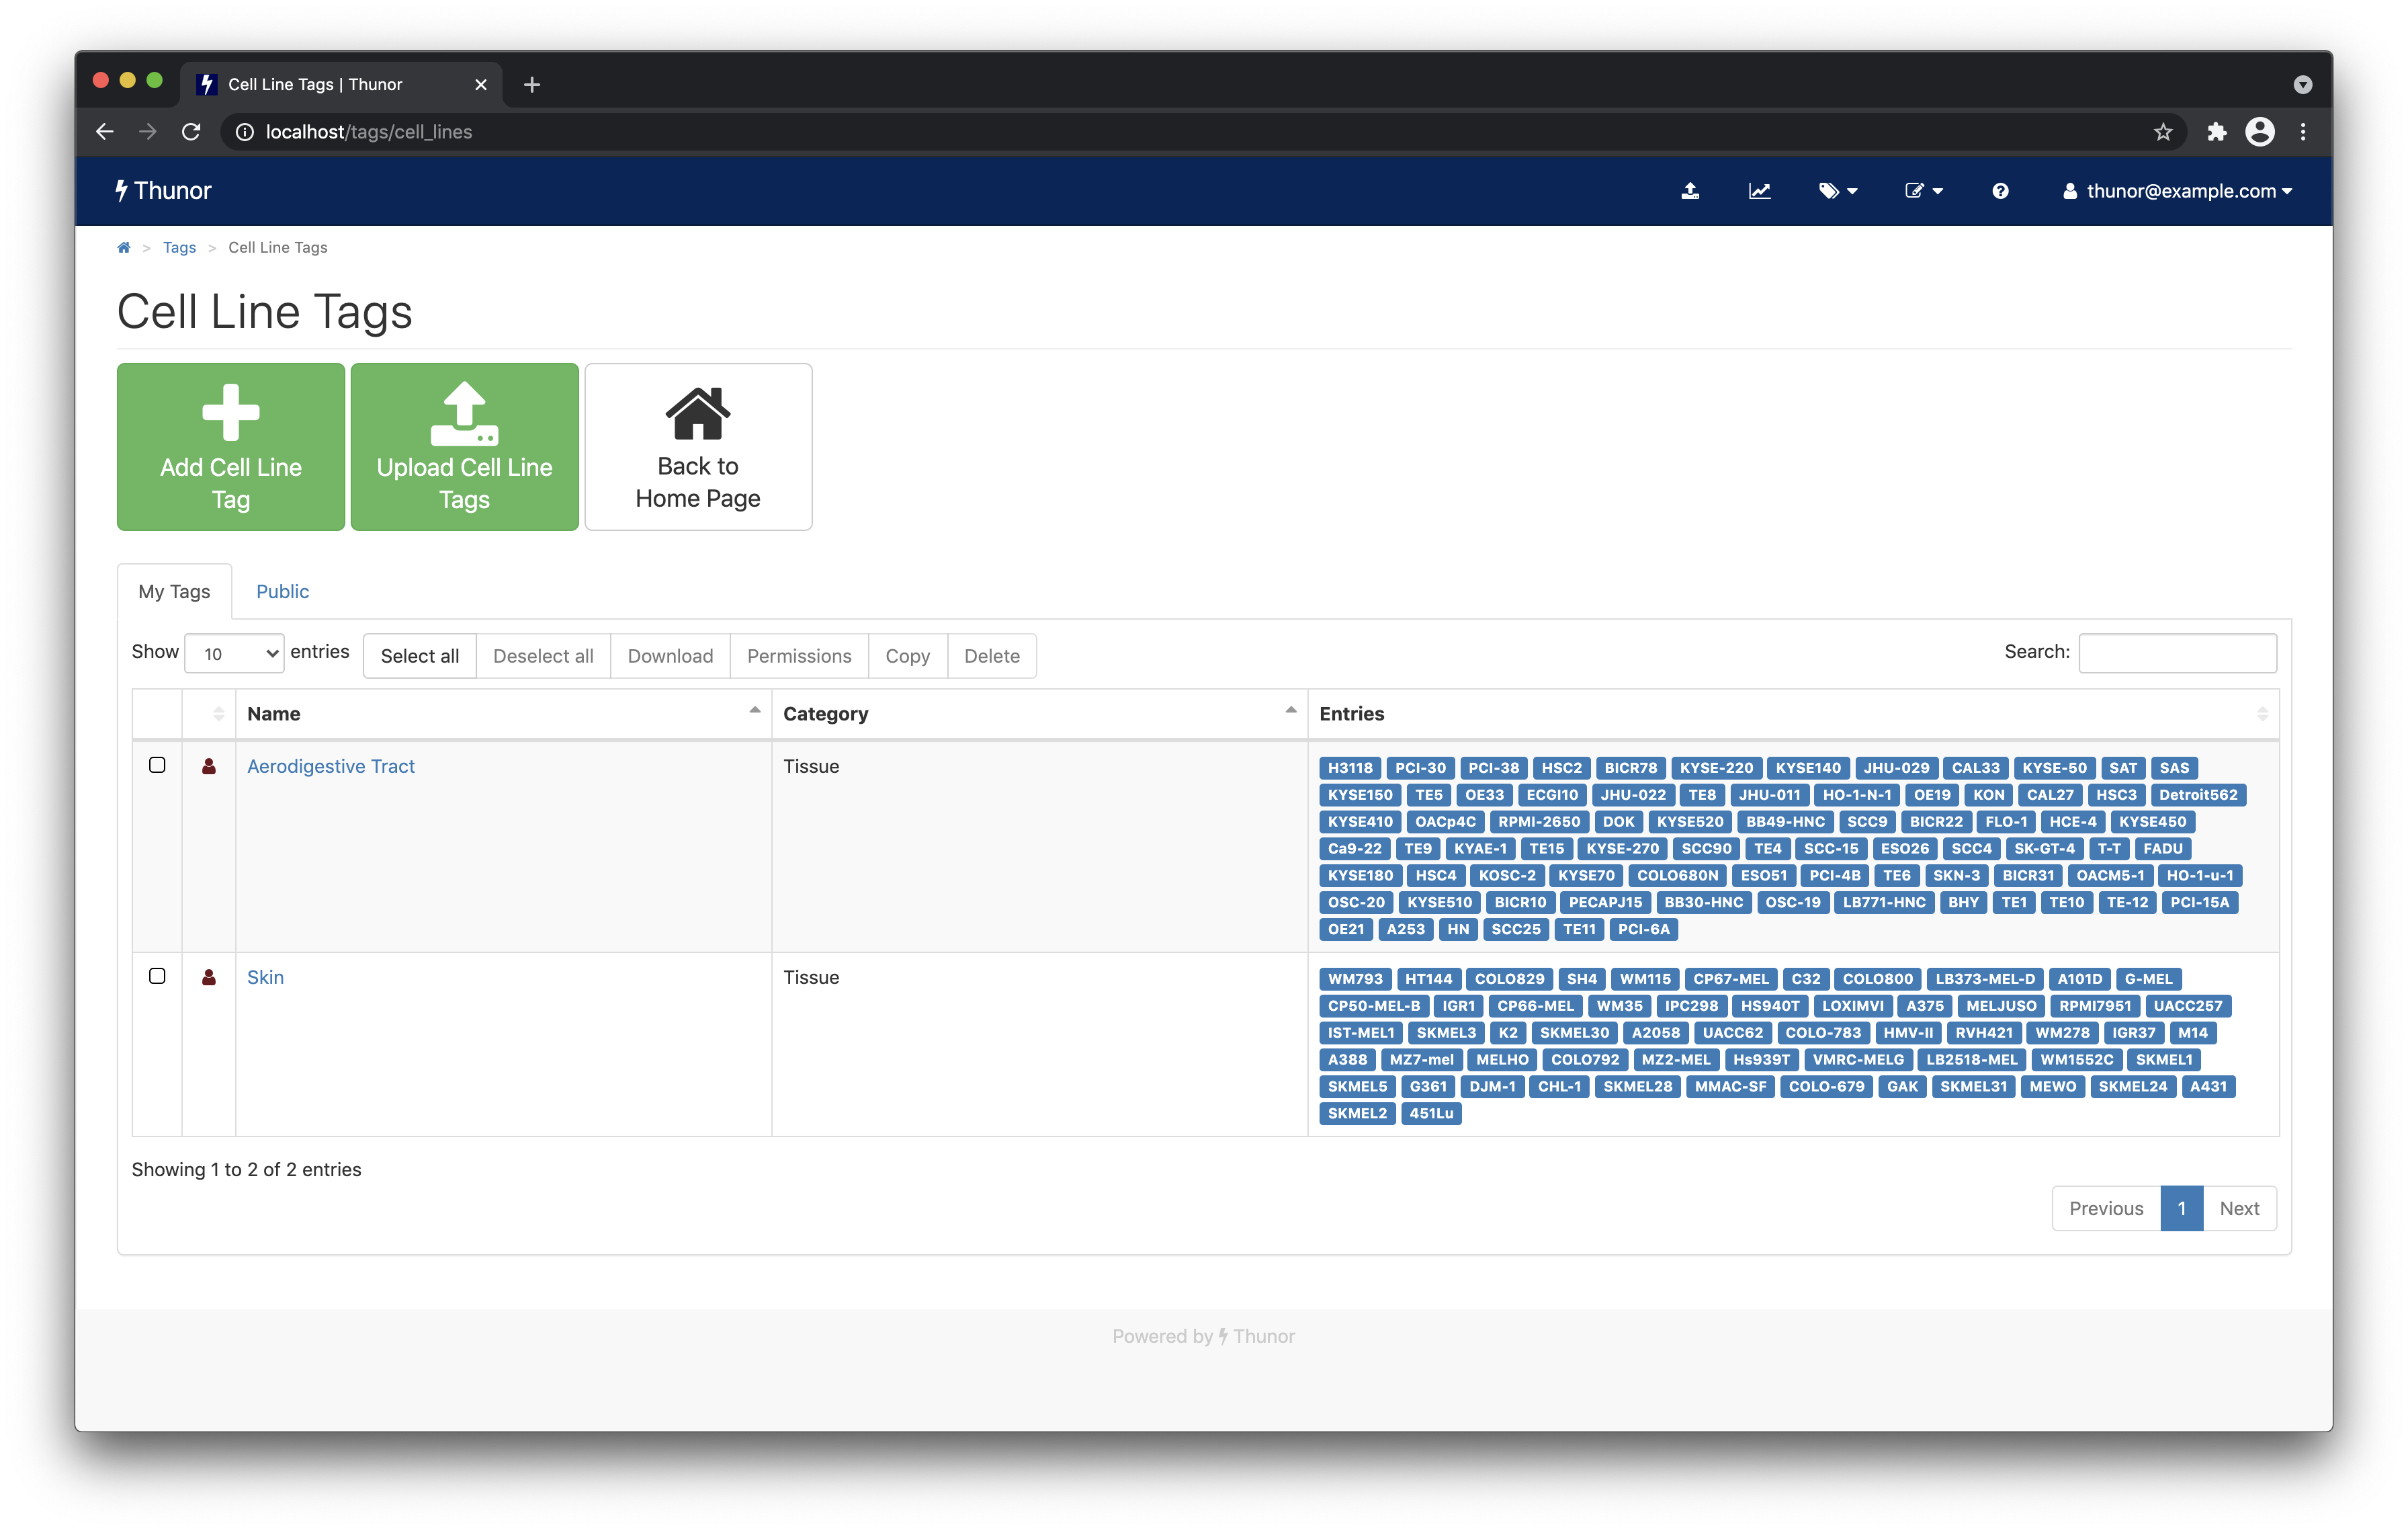 Image: Thunor Web - example cell line tags
Two example tags - "aerodigestive tract" and "skin" have been created, annotating several cell lines that originate from those tissues. Tags can be edited within this interface manually, and composite tags can be created using merge, intersection, and difference operations. Tags can also be shared with other users of the system by setting permissions, and downloaded for use with external tools. These features are all covered in the tag system documentation.
We've shown cell line tags here, but an analogous system exists for drug tags. Tags can be used to group cell lines and drugs in the plot system, both for visualization and for statistical tests.
Conclusions and further reading
Here, we've covered the basic functionality of Thunor Web, including installation; data upload, annotation, and sharing; the plot system; and the tag system. To explore the features of Thunor further, we recommend reading relevant sections user manual and exploring the online demo, which includes several datasets, including some labeled with tags.
Thunor is also available as a Python library, Thunor Core, which can be used with Jupyter Notebooks or within data analysis pipelines. Thunor Core has its own documentation, including a tutorial and modules reference.
If you're interested in installing Thunor Web for multi-user, networked use, see the installation instructions. Server admins will also want to read about the admin interface and list of configurable options.